Rectangle chart patterns are considered to be continuation patterns when conducting chart pattern analysis. Rectangles can be taken to the long side or to the short side depending on the direction of the prior trend so it is particularly important to do an analysis on this chart pattern with extreme caution or with a confirmation trading plan tactic.
Normally if the price is trending up and forms a Rectangle then you can consider the trend to continue up when the resistance has been broken. Obviously, we don't advise that you jump the gun because like any other chart pattern you need confirmation of price breaks before the pattern is confirmed. The same has to be said if the price is coming from the down side and a Rectangle is formed.
Use the Power of Continuation to Trade Successfully
This pattern does not vary in its development but to be considered a Rectangle price has to be contained by horizontal parallel trendlines which are the point of reference that we call the support resistance area. The way of identifying these areas are explained below. What is also a noticeable difference with this continuation pattern compared to other continuation patterns is that volume can do one of two things: it can decrease while it's in what we call the consolidation period or it can oscillate with the price which can be used for analysis to evaluate the direction of breakout when it comes.
Like with any continuation pattern this is the period in the price action where the stock needs to take a break / consolidate before continuing on its prior trends journey.
Ways to Identify:
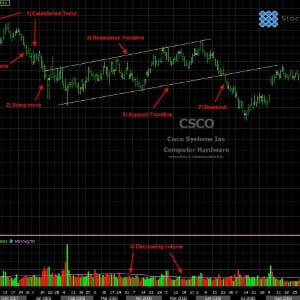
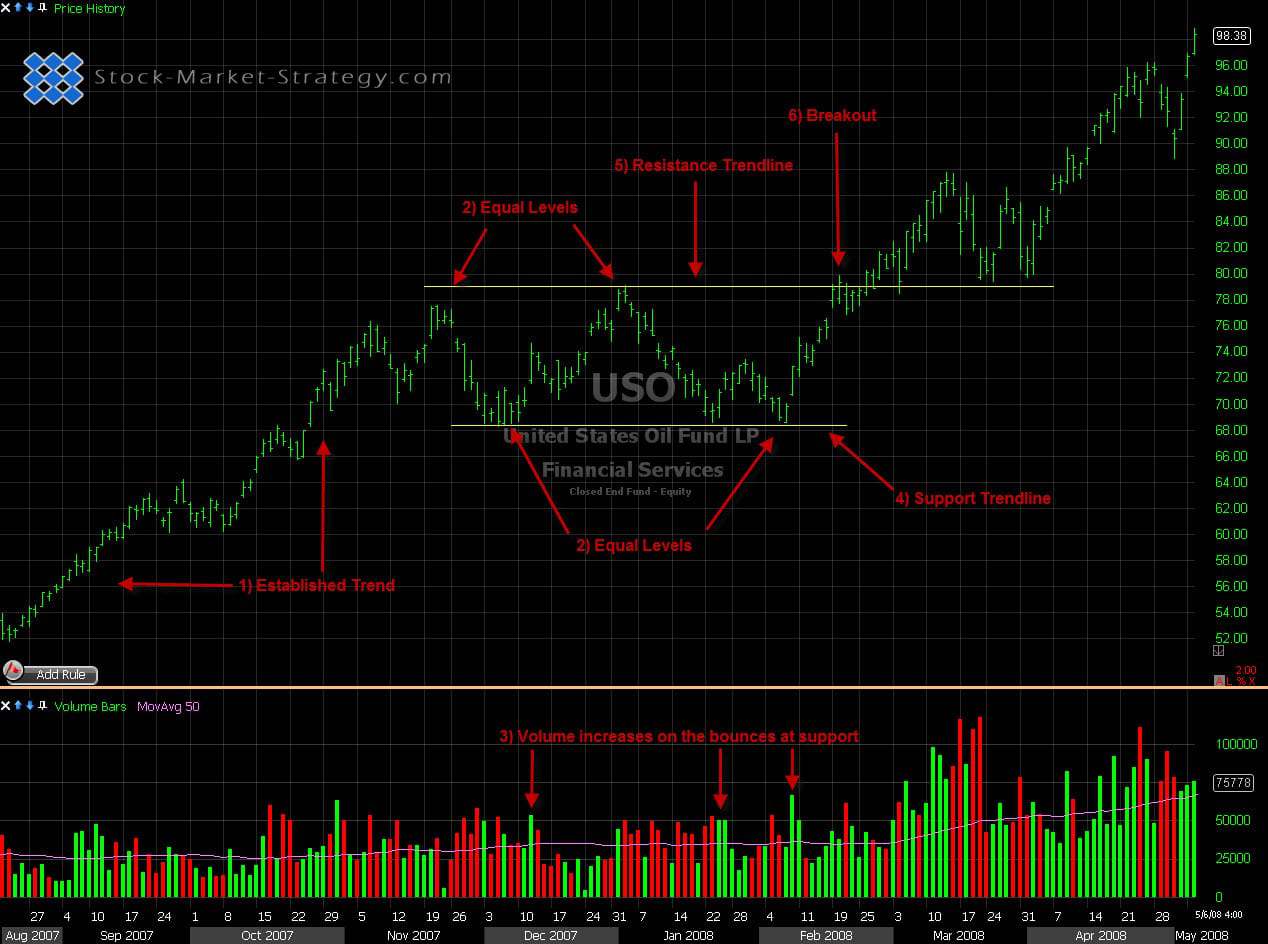
- Establish Trend - As with any other continuation pattern there must be an established trend to continue. The Rectangle has to be formed after an established up or down trend.
- Equal Levels - After the trend has been established the other associated requirement with the pattern is that equal highs and the equal lows which will indicate the areas that the horizontal parallel trendlines can be drawn from their must also be at least 2 equal highs and 2 equal lows for this pattern to be established.
- Volume - Rectangle patterns have characteristics that you should look out for when looking at volume. As mentioned above, the Rectangle pattern can have two characteristics when looking at volume 1, volume can often decrease as the indices goes into its consolidation period (Rectangle) 2, as the price oscillates between the price channels the volume increases and decreases with the advances and declines, identifying which is more significant can give you a heads up to the direction of the break out when it comes. Both of these volume examples should still give increase in volume signal at breakout.
- Support - The trendline that is supporting the equal lows in a Rectangle.
- Resistance - The trendline that is containing the equal highs in a Rectangle.
- Breakout - This is the confirmation that price action will continue in the direction of the prior trend. Confirmation still needs to be that the price closes outside the support / resistance area. You can often see price returning to test the support / resistance trendline but it does not necessarily have to. Also you can combine the breakout confirmation with a volume surge for extra confirmation.
**Breakout Confirmation- A very important thing to remember is to only take the breakout if it occurs in the same direction as the trend prior to the pattern. This is because, as previously mentioned, it is a continuation pattern.
Spotting the Rectangle chart pattern
Styles Traded:
- Entry - When a Rectangle breaks out of its resistance on a closed basis it takes out at least 2 swing pivots in the pattern. This adds to the confirmation but because of the shape of the pattern stop losses can often be bigger and you have to weigh this up against your projected reward.
- Might Miss - Price retests the resistance trendline which now becomes support area.
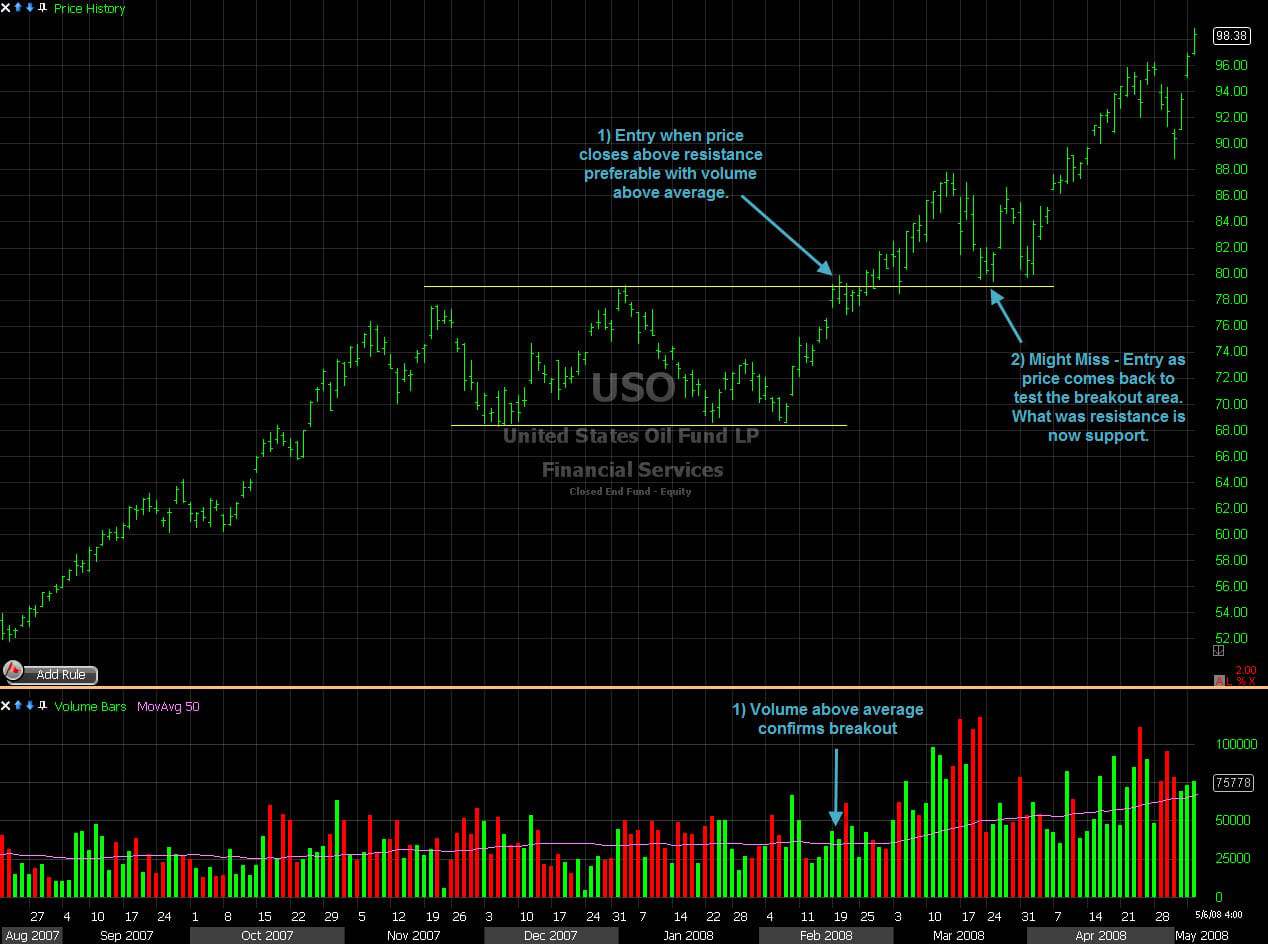
How to enter the Rectangle chart pattern
All trading style entries have their strength and weaknesses and will come down to the trading style of the individual trader and their tolerance to money management (R&R).