Head and Shoulders are known as reversal chart patterns and are formed after an extended price move to the upside. The completion of this chart pattern denotes a trend reversal and in this case from an uptrend into a downtrend.
Be on the Right Side of the Head & Shoulder Pattern to Benefit in Your Trading
You can identify the Head and Shoulder chart patterns when doing your chart analysis by its distinct left shoulder, head in the middle, right shoulder all supported by a prominent support area which is known as the neckline.
As with other chart patterns, these come in other variations and by that we mean that it is sometimes the left shoulder can be higher than right shoulder or right shoulder can be higher than left or sometimes they can be equal.
This Head and Shoulders reversal pattern like other chart patterns analysis comes into its own when significant areas of support resistance are broken and confirmed.
Ways to Recognise:
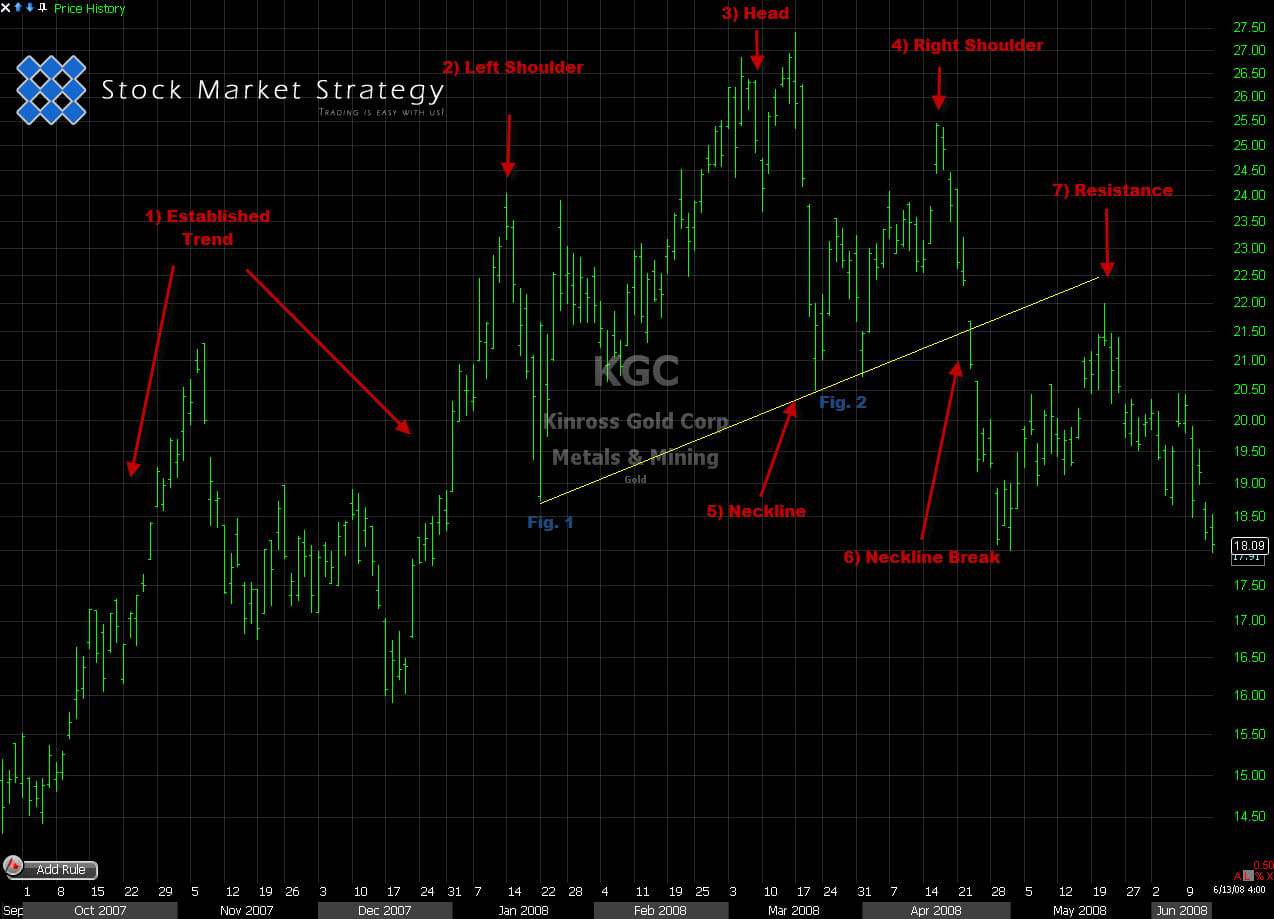
- Establish Trend - The Head and Shoulder like any other reversal chart pattern there must be a long term established trend to reverse. Head and Shoulders have to be formed after a significant uptrend.
- Left Shoulder - This price action is normally contained in the upward major trend line within the significant uptrend and you will see that the price will test the trend line which will also correlates to what will later become the neckline.
- Head - After the left shoulder has been created and price action starts moving upwards you will see it will take out the prior pivot high of the left shoulder making a new high. At this point keep an eye on volume as you will normally see it dry up and the price will start returning back to the area of support (neckline).
- Right Shoulder - Now the area of support has been created the price action can now begin to test the price action of the head. This rally will exhaust itself before reaching the high price of the head and will be known as what we call a failure to take out previous high. This is the first major bearish signal.
- Neckline - Now the left shoulder has been formed and the head is starting to pull back down to create the right shoulder we can draw in what we call a neckline (trendline). This can be drawn off the retracement of the left shoulder Fig.1 - Fig.2 which is when the price rallies up to create the right shoulder.
- Neckline Break - Now that the right shoulder has been establish and price has been rejected price will retrace to the neckline area. As the pattern has been created over a 2-3 month period the neckline area will more often than not be tested a few times before breaking. Only after the support of the neckline has been broken and the price action has closed under neckline support can we be sure that the pattern is confirmed.
- Resistance - What was neckline support now becomes neckline resistance and more often than not will be tested by the price and rejected. This is the chance for you to either exit all long positions from previous uptrend or enter your short position in the market.
How to spot the Head & Shoulders chart pattern
Styles Traded - Three ways to Trade Head and Shoulders:
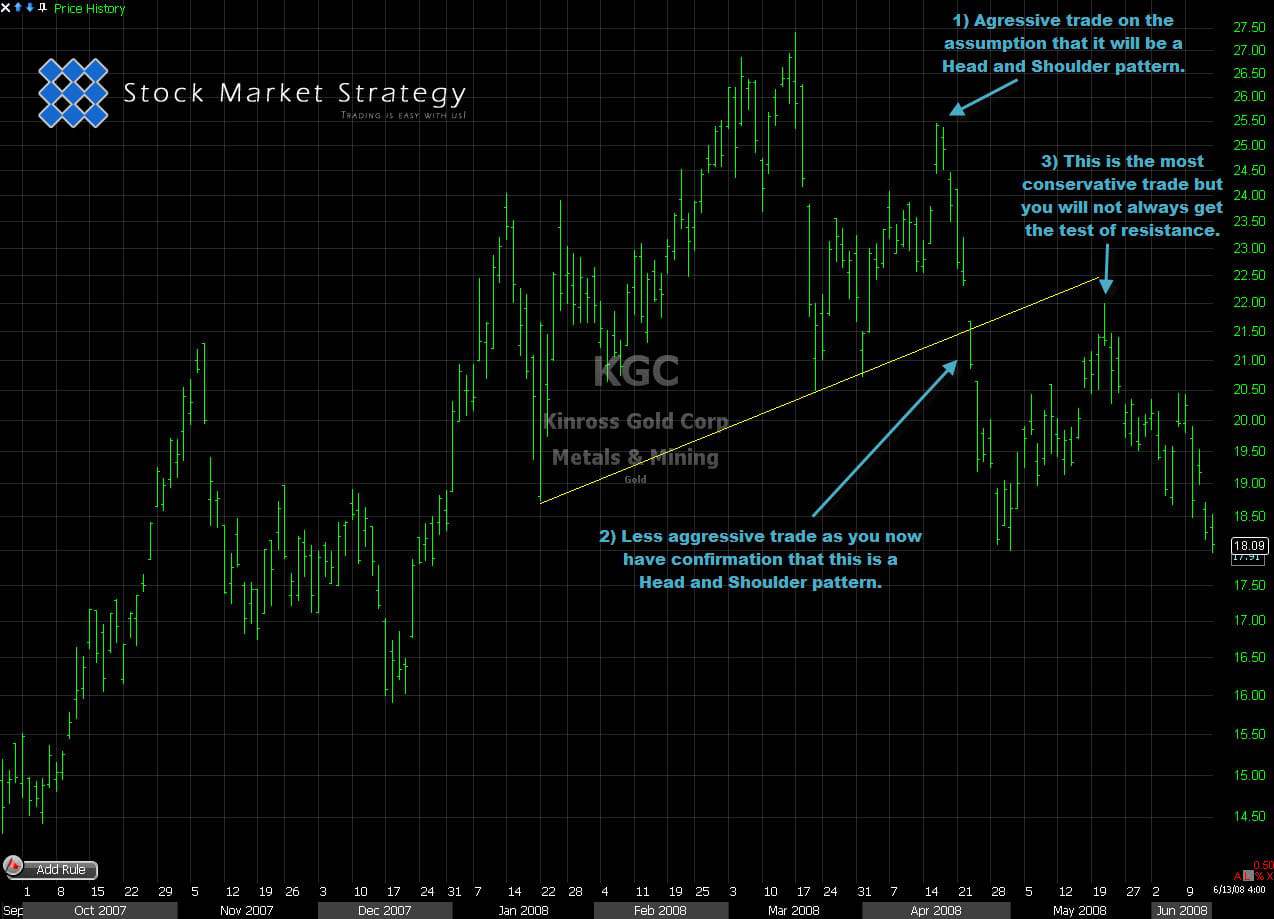
- Very Aggressive - When price action of the right shoulder fails to reach the price level of the head and reverses in an aggressive manner. Implement a candle stick formation for entry. This is considered a low odds trade and you will be stopped out more often.
- Less Aggressive - Price breaks neckline support area and closes underneath. This has a bigger stop loss but is more confirmation that it's on its way down.
- Might Miss - Price retests the neckline support area which is now the resistance area.
Trading the Head & Shoulders pattern
All three trading style entries have their strength and weaknesses and will come down to the trading style of the individual trader and their tolerance to money management (R&R). Like with all the reversal patterns there are topping price action patterns and bottoming price action chart patterns.