Flags & Pennants chart patterns are considered to be continuation patterns when conducting chart pattern analysis. Flags and Pennants can be taken to the long side or to the short side depending on the direction of the prior trend so it is particularly important to do an analysis on this chart pattern with extreme caution or with a confirmation trading plan tactic.
Normally if the trend has come from the upside and formed a Flag or Pennant then you can consider the trend to continue up when the resistance has been broken. Obviously, we don't advise that you jump the gun because like any other chart pattern you need confirmation of price breaks before the pattern is confirmed. The same has to be said if the price is coming from the down side and a Flag or Pennant is formed.
Learn How to Trade Continuation Patterns
These two chart patterns do not vary in their development but to be considered a Flag or a Pennant it has to have a sharp increase or decline in price action with noticeable increase in volume. The trendlines that contain both chart patterns need a point of reference to be drawn which is also the area that we call the support resistance area. The two different ways of identifying both of these areas are explained below.
Like with any continuation pattern this is the period in the price action where the stock needs to take a break / consolidate before continuing on its prior trends journey.
Flag - The shape of the flag is recognisable as it forms in the opposite direction to the established trend contained by parallel trendlines that slope.
Pennants - These are similar to Symmetrical Triangles, but the difference is the sharp up move and they are 90% neutral with lower highs and higher lows.
How to Identify the Chart Pattern:
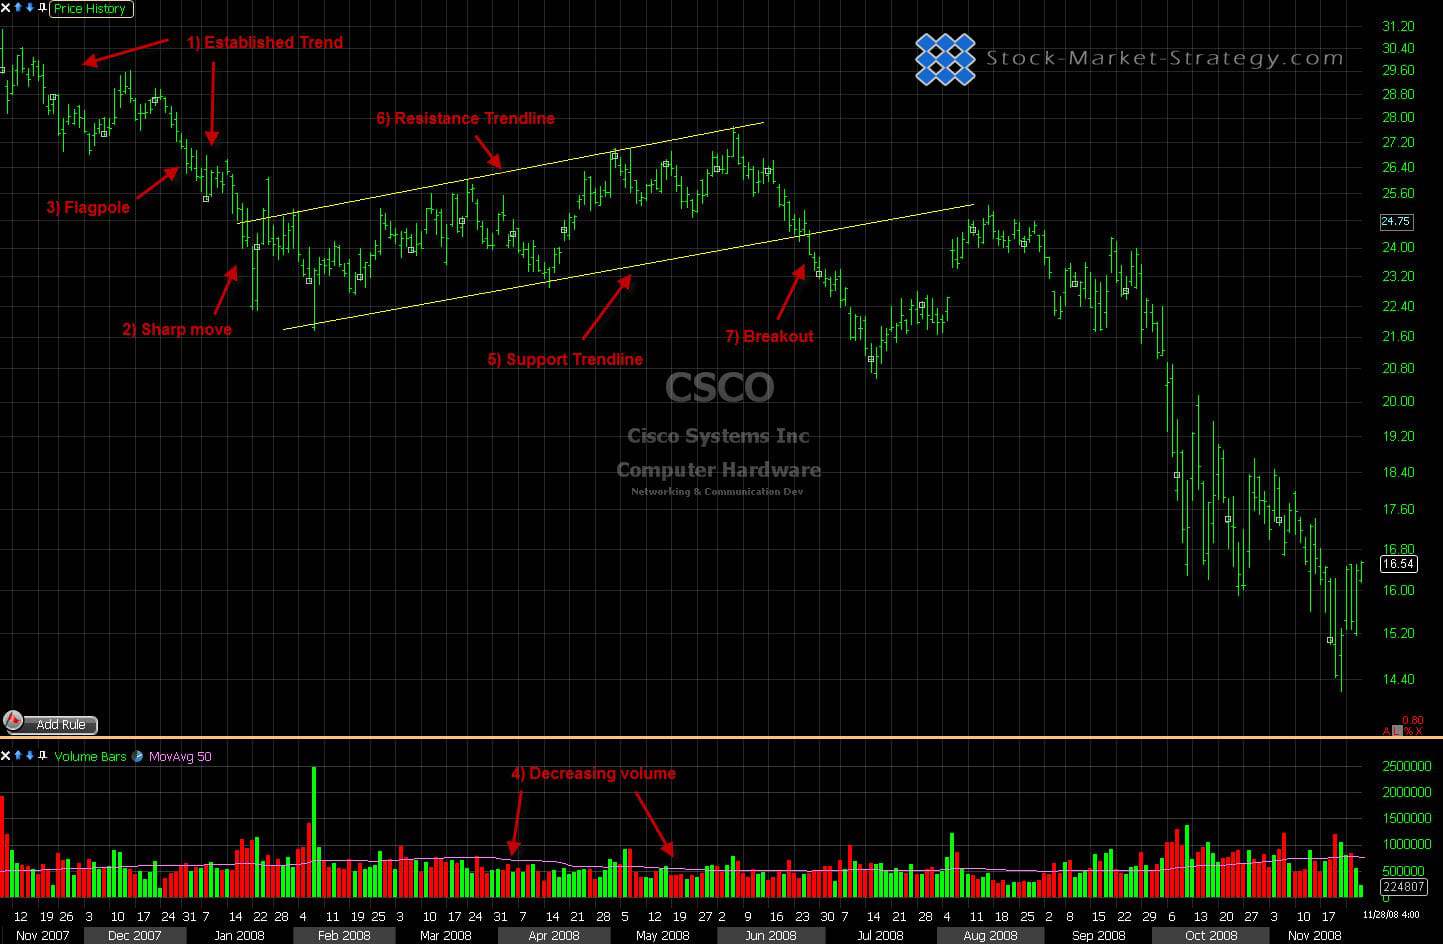
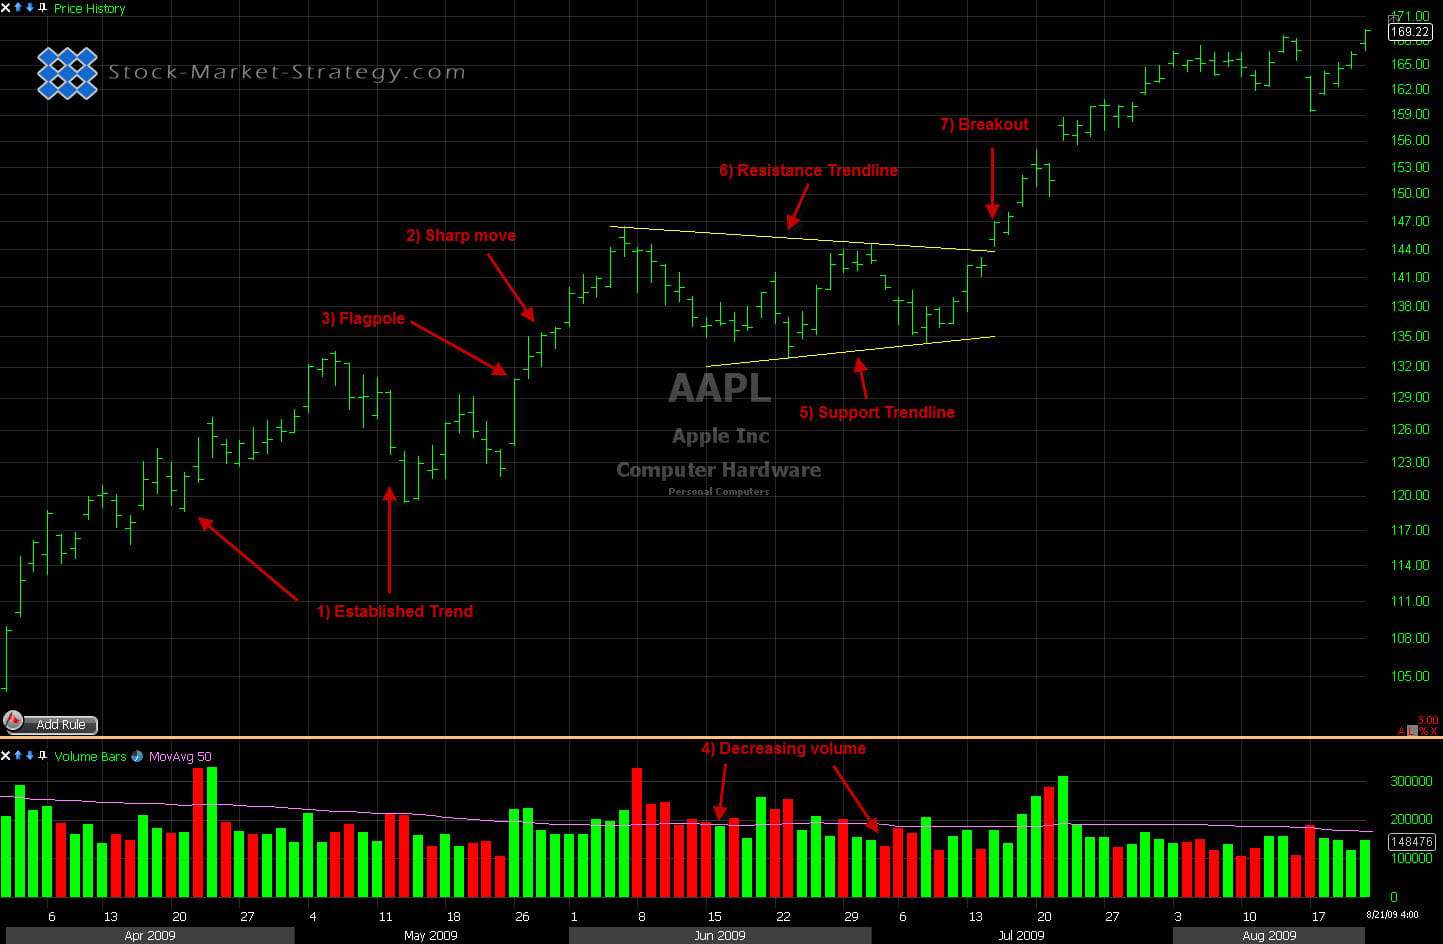
- Establish Trend - As with any other continuation pattern there must be an established trend to continue. Flags & Pennants have to be formed after an established up or down trend.
- Sharp Move - After the trend has been established the other associated requirement with the pattern is that the trend has an accelerated move in price which is a flagpole.
- Flagpole - The flagpole is the distance from the first resistance or support break from the previous move to the high or low of the flag/pennant.
- Volume - Both of these chart patterns have characteristics that you should look out for when looking at volume. The main being increase of volume at the break out point and the second is a decrease in volume while in the consolidation stage of the pattern.
- Support - The trendline that is supporting the higher lows in an uptrend and vice versa in a downtrend.
- Resistance - The trendline that is containing the lower highs and vice versa in a downtrend
- Breakout - This is the confirmation that price action will continue in the direction of the prior trend. Confirmation still needs to be that the price closes outside the support / resistance area. You can often see price returning to test the support / resistance trendline but it does not necessarily have to. Also you can combine the breakout confirmation with a volume surge for extra confirmation.
**Breakout Confirmation - A very important thing to remember is to only take the breakout if it occurs in the same direction as the trend prior to the pattern. This is because, as previously mentioned, it is a continuation pattern.
Spotting the Flag chart pattern
Spotting the Pennant chart pattern
Styles Traded - Ideas How Pennants can be Traded:
- Entry Pennant - Price breaks resistance area and closes above. This has a tight stop loss due to the narrowing of the price action but is more confirmation that it's continuing upwards.
- Pennant Confirmed Entry - Take out last swing pivot in the pattern. This is a confirmation trade and gives a later entry but it gives you more evidence you're the right side of the market.
- Might Miss - Price retests the resistance trendline which now becomes support area.
- Late Entry - Price takes out the top or bottom of the Pennants price action big stop loss, but extra confirmation but tighter gains.
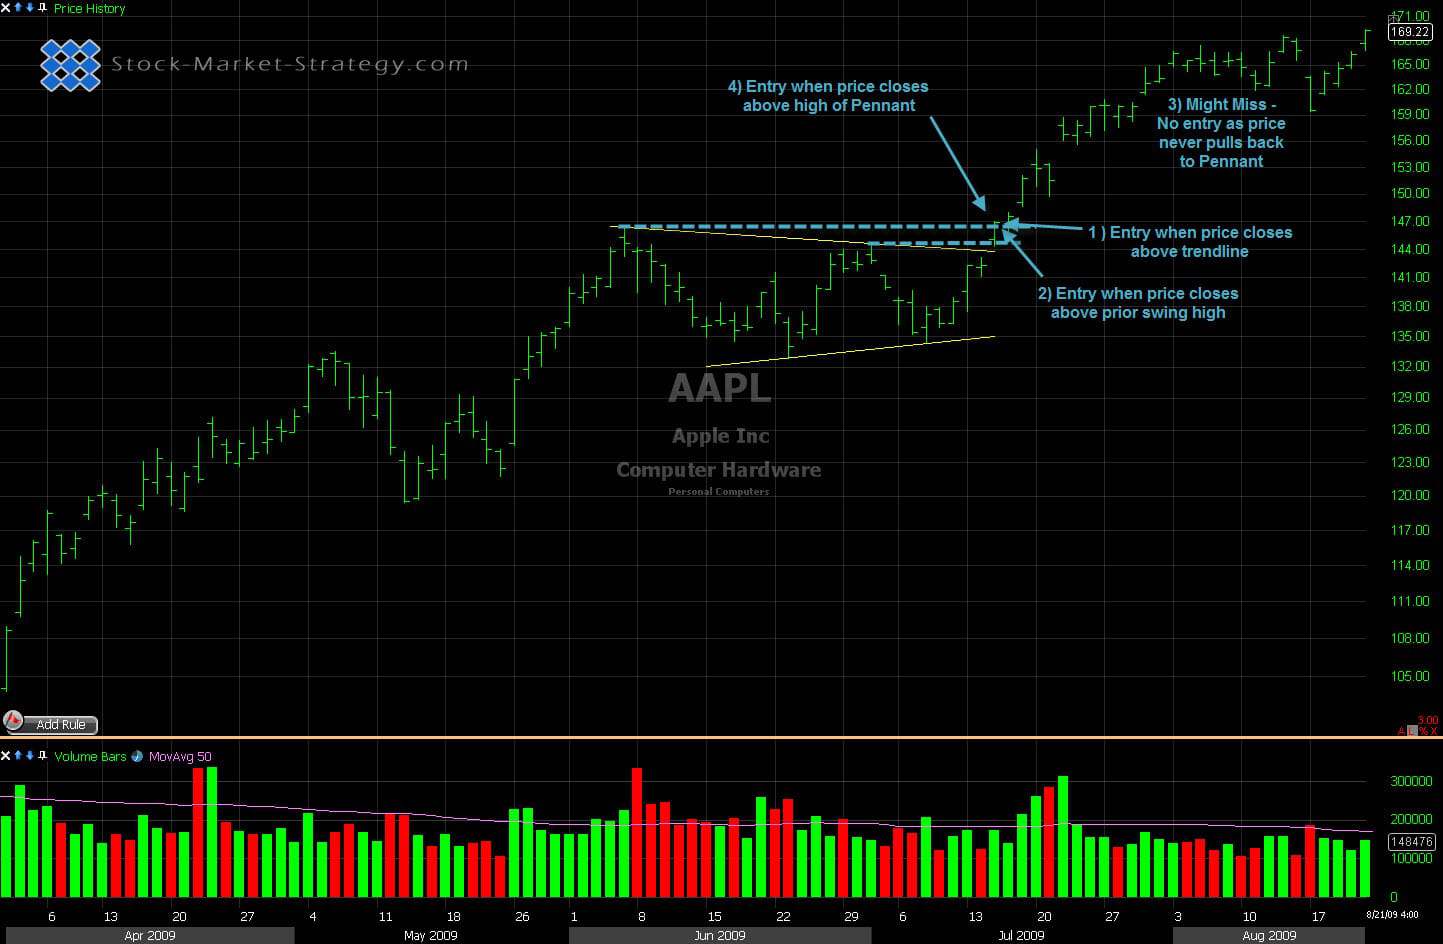
Trading the Pennants
How Flags can be Traded:
- Entry Flag - Price breaks resistance area and closes above. The stops can be slightly bigger compared to the Pennant because the price range does not narrow but it does give confirmation that it's continuing in the prior trends direction.
- Flag Confirmed Entry - Take out last swing pivot in the pattern. This is a confirmation trade and gives a later entry but it gives you more evidence you're the right side of the market.
- Might Miss - Price retests the resistance trendline which now becomes support area.
- Late Entry - Price takes out the top or bottom of the Flags price action big stop loss, but extra confirmation but tighter gains.
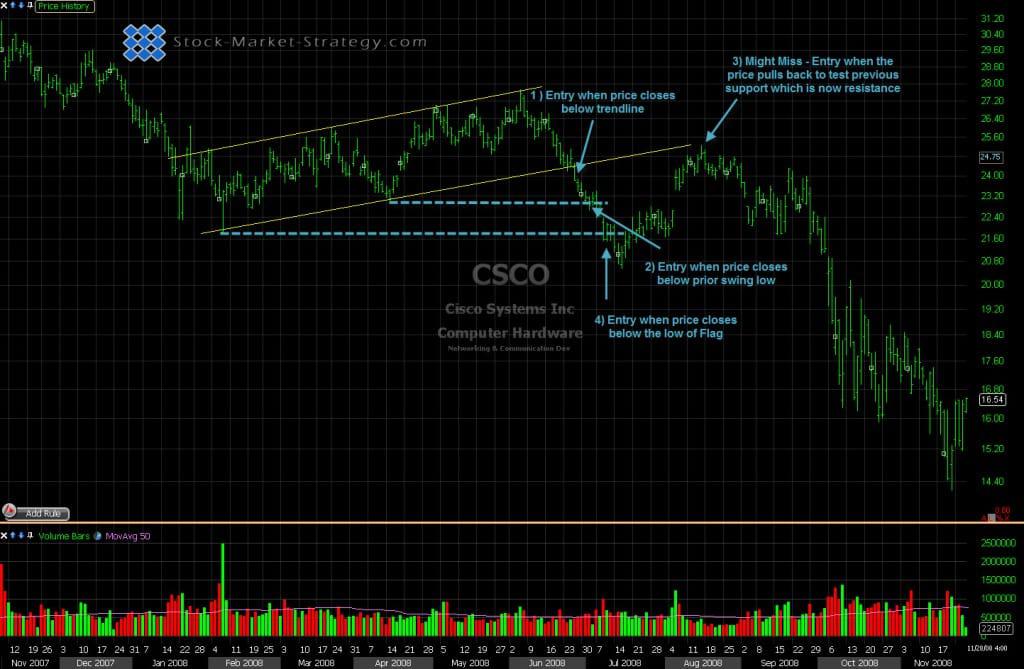
Trading the Flag chart pattern
All trading style entries have their strength and weaknesses and will come down to the trading style of the individual trader and their tolerance to money management (R&R).