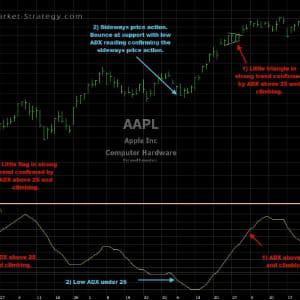
Average Directional Index - ADX
Indicators
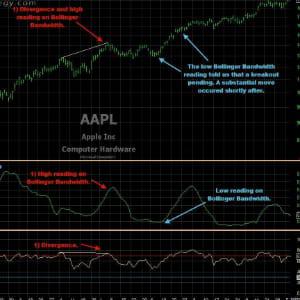
Bollinger Band Width
Indicators
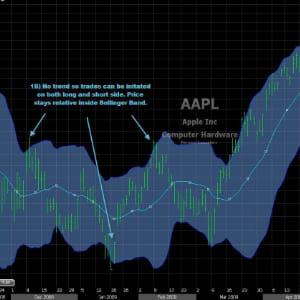
Bollinger Bands
Indicators
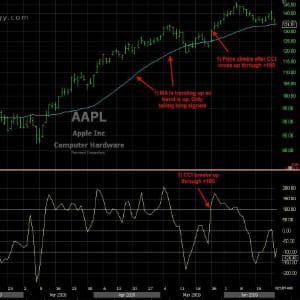
Commodity Channel Index – CCI
Indicators
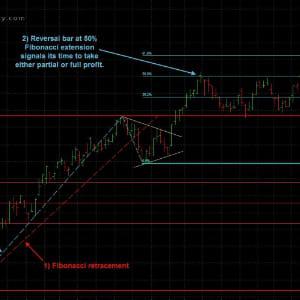
Fibonacci Retracements / Extensions
Indicators
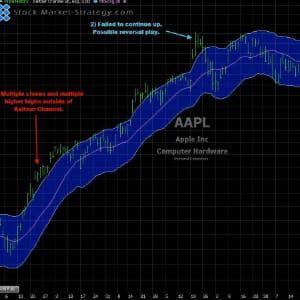
Keltner Channels
Indicators
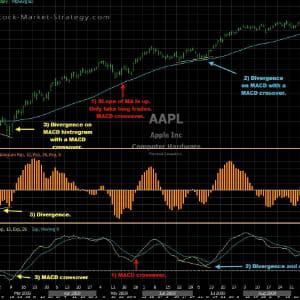
Moving Average Convergence Divergence - MACD
Indicators
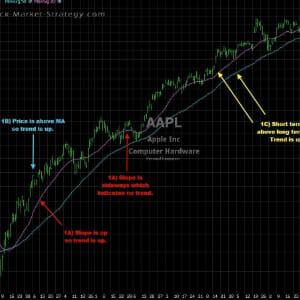
Moving Averages - MAs
Indicators
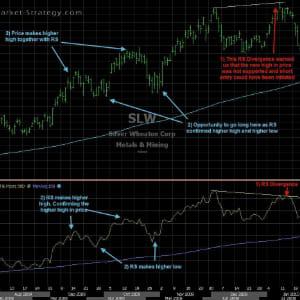
Relative Strength
Indicators
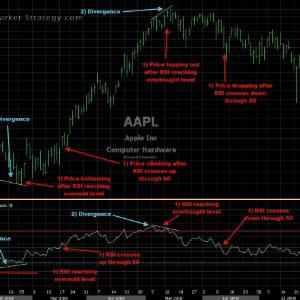
Relative Strength Index - RSI
Indicators
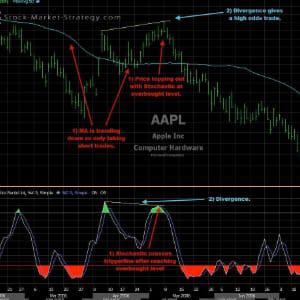
Stochastic
Indicators