The Fibonacci sequence was introduced to the west by Leonardo Pisano Bogollo more than 800 years ago. We run into the Fibonacci sequence on a daily basis such as playing cards dimensions, Greek art, computer screen ratio's and many more so it is no surprise that Fibonacci has found its way into trading.
The sequence
Fibonacci numbers are 0, 1, 1, 2, 3, 5, 8, 13, 21, 34, 55, 89.......
Fibonacci works like this. 0 +1 = 1 and 1+1 =2 and so forth. After 0 and 1 each number is the sum of the two prior numbers. For example: 13 come from 5+8. 21 come from 8+13.
The Fibonacci retracements/extension levels are calculated used Fibonacci numbers. The most popular is 61.8 and 38.2%. Another used number is 23.6 and these are often rounded to 62, 38, 24% respectively.
To get to the calculations for the Fibonacci % most commonly used when trading we take 13 or any Fibonacci to start with as the index number and divide it by the following numbers in the sequence to give you the Fibonacci % levels.
- 13 / 21 = 62%
- 13 / 34 = 38%
- 13 / 55 = 24%
Levels
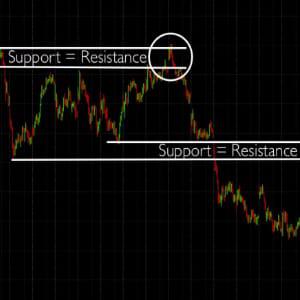
Like with any support/resistance it is important to understand that these Fibonacci Levels are more like zones. Price will often oscillate around these areas as they are not hard reversal points but potential reversal points. It is therefore important to use Fibonacci retracements/extensions with other indicators and/or chart analysis.
Learn How to Trade using This Technical Indicator
Many traders keep an eye on these numbers and that makes it a self-fulfilling prophecy. Support/resistance is about finding areas where you believe price will bounce/reverse off and you can do this by making a qualified guess that there will be many trades waiting to buy/sell the security at certain areas. If you know where the Fibonacci retracement/extension levels are you can predict where there will be a larger than normal amount of buyers/sellers.
Tips and Ideas: When to Trade the Fibs
We now know how the levels are calculated and we also know why they work but we still need to know exactly how to using Fibonacci levels in trading.
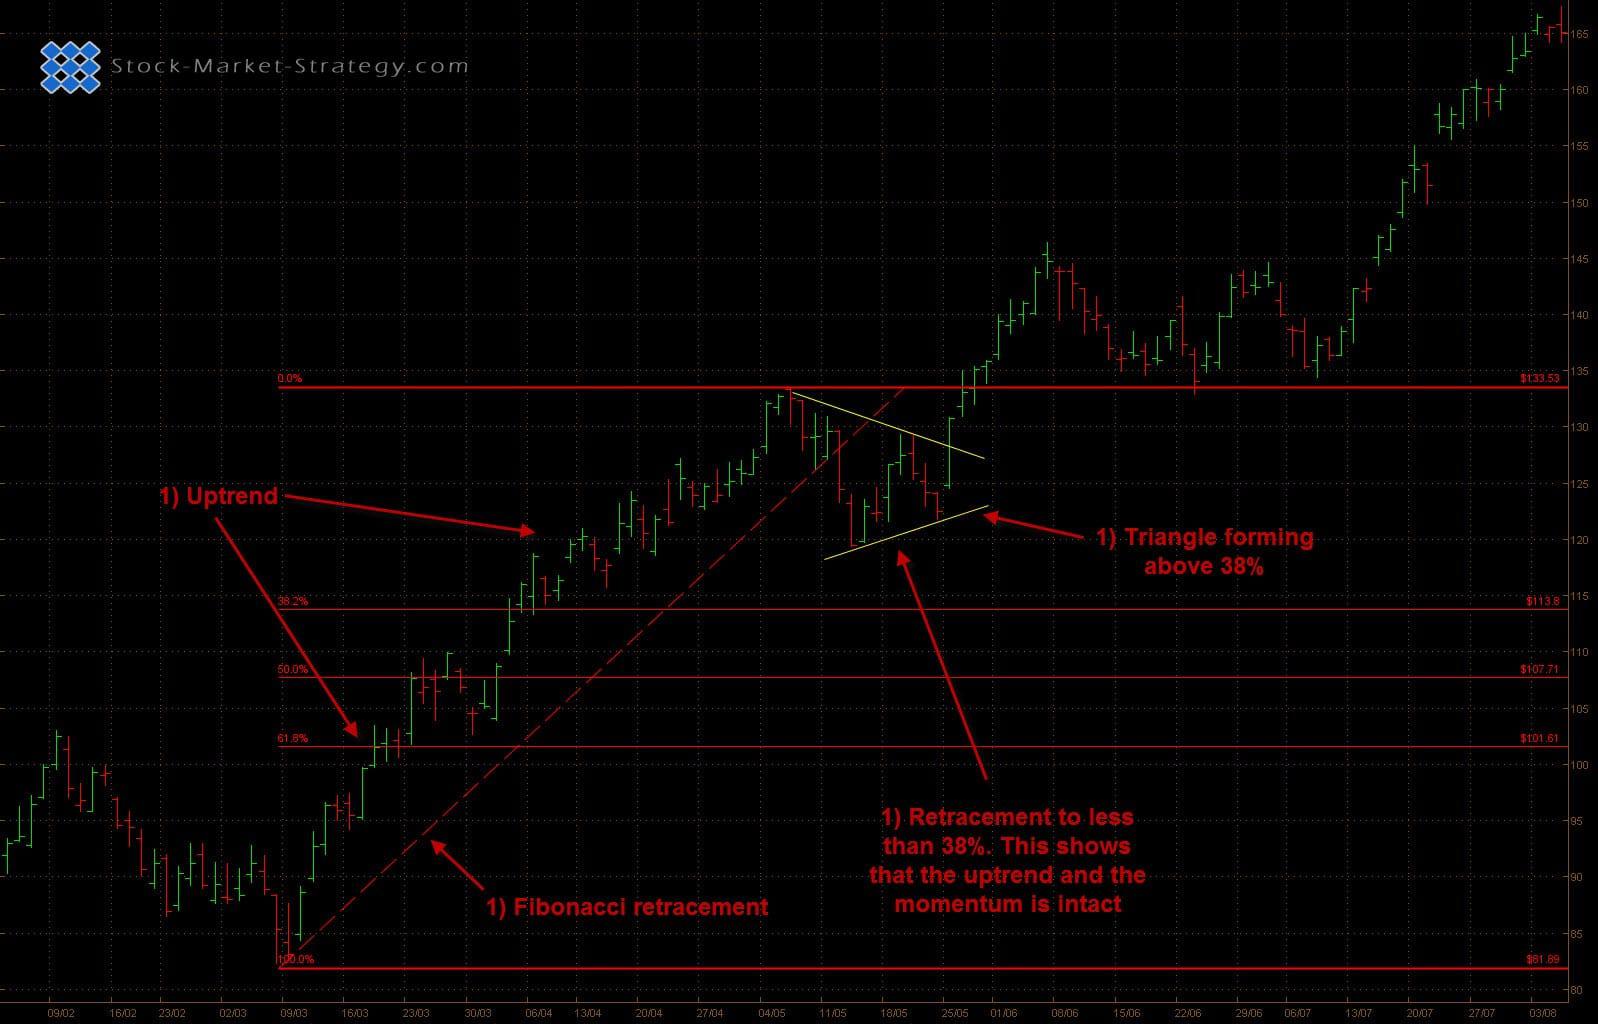
1) A good idea is to use Fibonacci retracement when looking to buy a pullback in an uptrend. For example flags and triangles are great for entering a pullback in an uptrend. As flag and triangles are continuation patterns traders like to make sure that the current trend is still intact. They therefore use Fibonacci retracement to make sure that the current pullback is no bigger than 38%. Furthermore many traders like momentum and when the security only pulls back to 38% the odds are in their favor that the momentum is still intact.
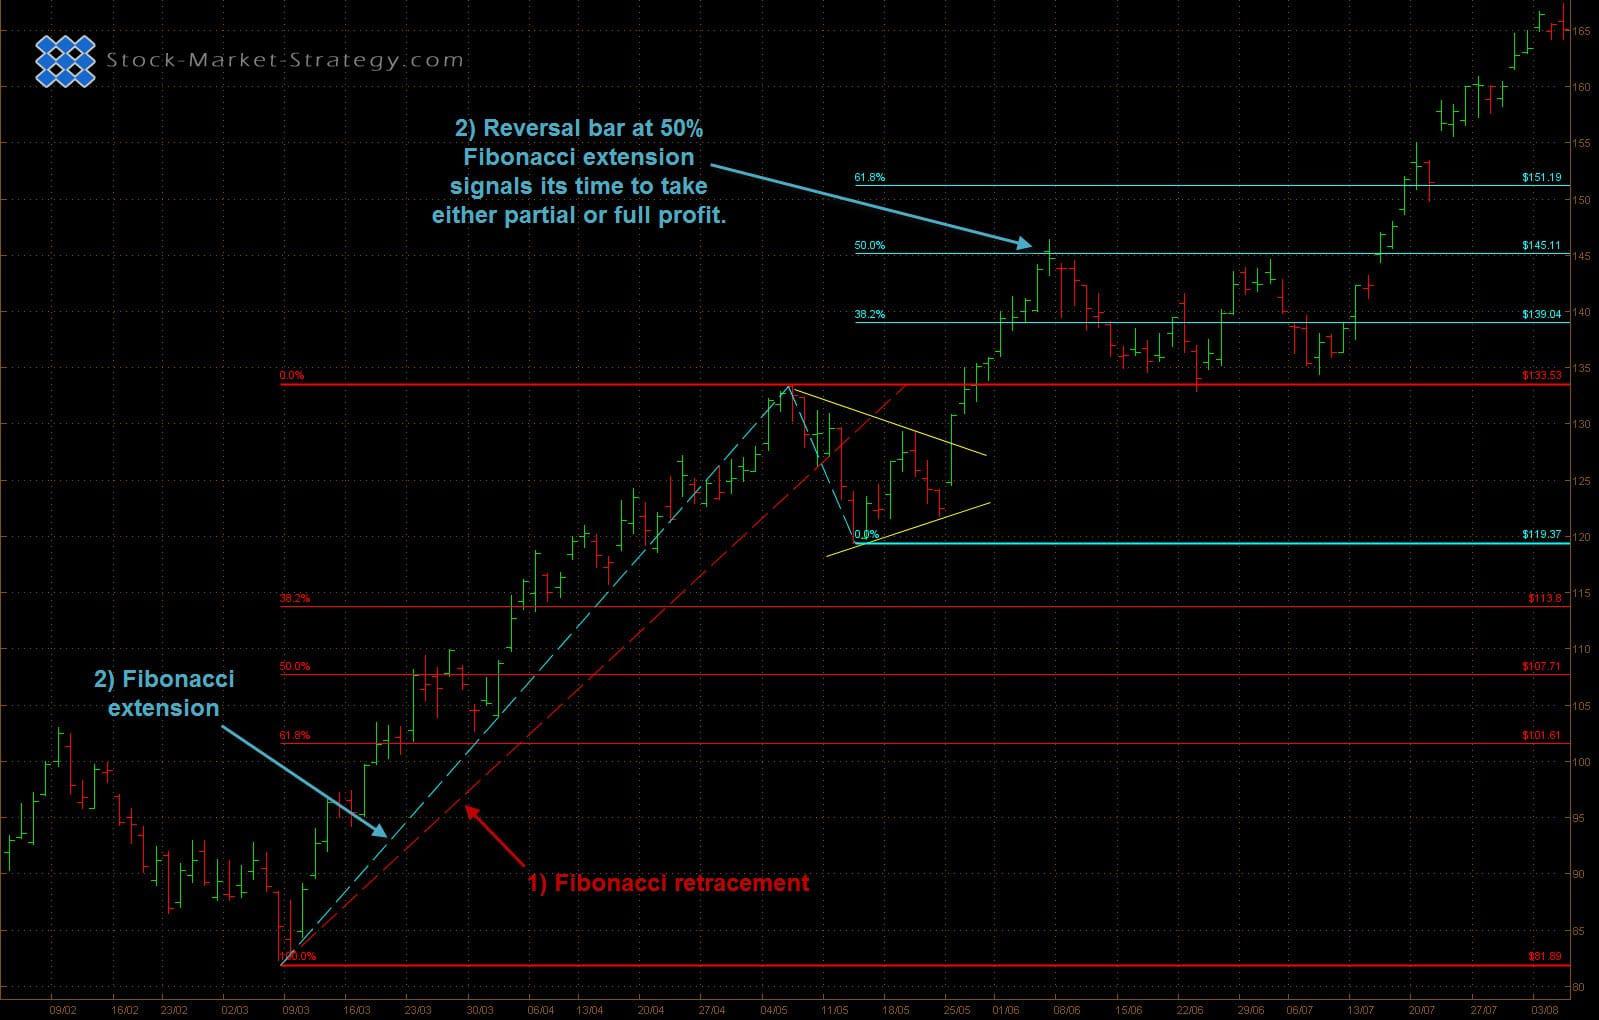
2) Fibonacci extension is a great tool for helping traders take profit. You have predetermined levels of potential support/resistance so you are already prepared to take profit at these levels if you see any form of reversal. By having predetermined levels you are removing a bit of uncertainty and thereby emotions. This is an important thing in trading as detailed in the emotions section of the website.

Buy pullback to Fibonacci Retracement
2) Fibonacci extension is a great tool for helping traders take profit. You have predetermined levels of potential support/resistance so you are already prepared to take profit at these levels if you see any form of reversal. By having predetermined levels you are removing a bit of uncertainty and thereby emotions. This is an important thing in trading as detailed in the emotions section of the website.

Use Fibonacci Extension for potential profit targes
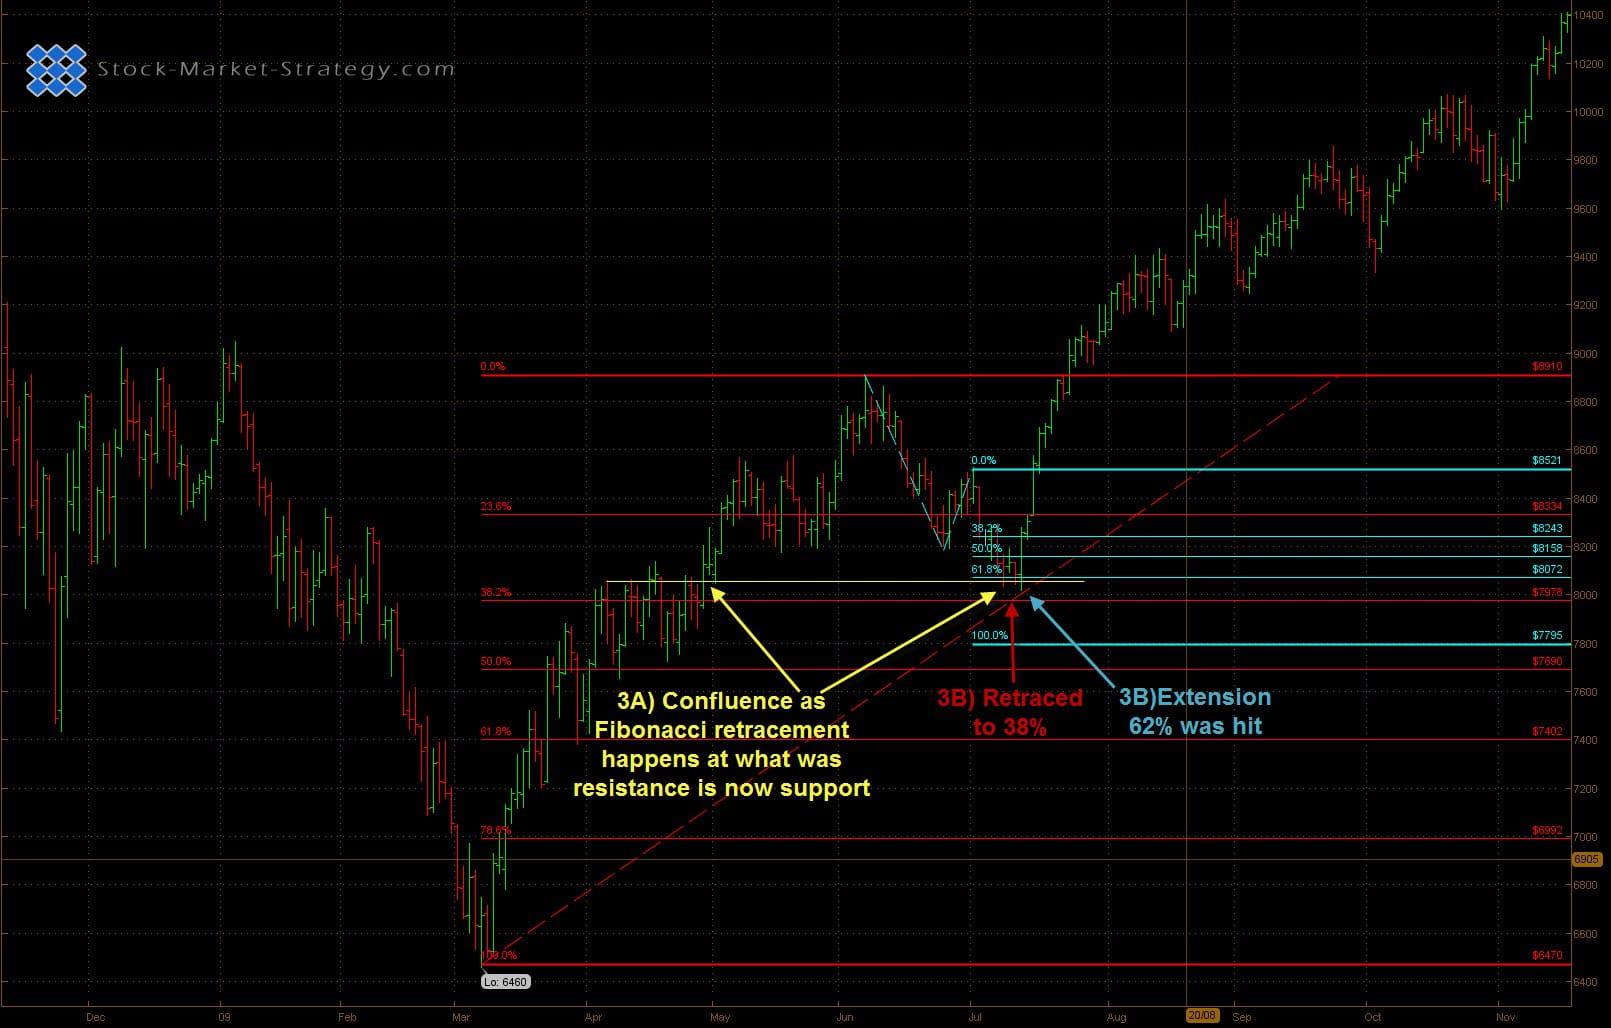
3) Trading is about having an edge so the more factors suggesting a trade is good, the better. However, that does not mean trading with 10 indicators but more areas of confluence.
- This could be a Fibonacci retracement to already established support/resistance. For example prior swing high/low.
- Area of confluence can also be a cluster of Fibonacci retracement and extension. If the major move is down, you draw in a Fibonacci retracement. If the bounce up happens to be an ABCD move you can measure the extension of the ABC move. This way you have several Fibonacci levels.

Combine Retracement with Extensions for high odds trades
Our Implementation:
We normally use Fibonacci retracement to gauge the strength of a trend. As long as the pullback/retracement is no bigger than 50% then the trend is still strong. If price reaches 62% then we are careful of any other signs that the trend might end.
Fibonacci extension is one of our favorite tools for locating profit target points. We always keep an eye on these areas so we do not get surprised about a sudden reversal and subsequently giving away all open profit.
