The Moving Average Convergence Divergence (MACD) was invented by Gerald Appeland is one of the most widely used indicators. This is probably due to the simplicity of calculation and reliability of the signals. The Moving Average Convergence Divergence technical analysis uses two moving averages MA (most often exponential moving averages-EMA) and subtract the longer period MA from the shorter period MA and the results is a line that oscilliates above and below zero. This gap between the two MAs shows the momentum.
Identifying Divergence Using Histogram
The most used settings for this technical analysis is a 26 and a 12 exponential moving average. Choosing a shorter EMA will result in a quicker indicator which then signals trades sooner than the traditional settings. This will likely give more whipsaws. It is therefore important to do a back test to see if the faster signals will outweigh the whipsaws. Choosing a longer EMA will give fewer but more reliable signals, often catching the major moves.
Commonly Used Settings
Usually a 9 EMA is plotted together with the Moving Average Convergence Divergence to give you a quicker signal than the 26 and 12 EMA crossover (MACD move above zero). Often you will see a histogram which is the difference between the MACD technical analysis and the 9 EMA. The histogram is below zero when the MACD is below the 9 EMA and the histogram is above zero when the it is above the 9 EMA.
A Moving Average Convergence Divergence above zero means that the 12 EMA is above the 26 EMA and that tells us that the trend is up. If the MACD is declining while above the zero it is telling us that the momentum to the upside is decreasing. This can warn us that the trend might change. If the 26 EMA is above the 12 EMA the MACD would be under zero. A rising MACD under zero tells us that the momentum is decreasing and a potential trend reversal could be in the cards.
Tips and Ideas
We now know that the MACD tells us and when the entry signal appears but we can do better than that:
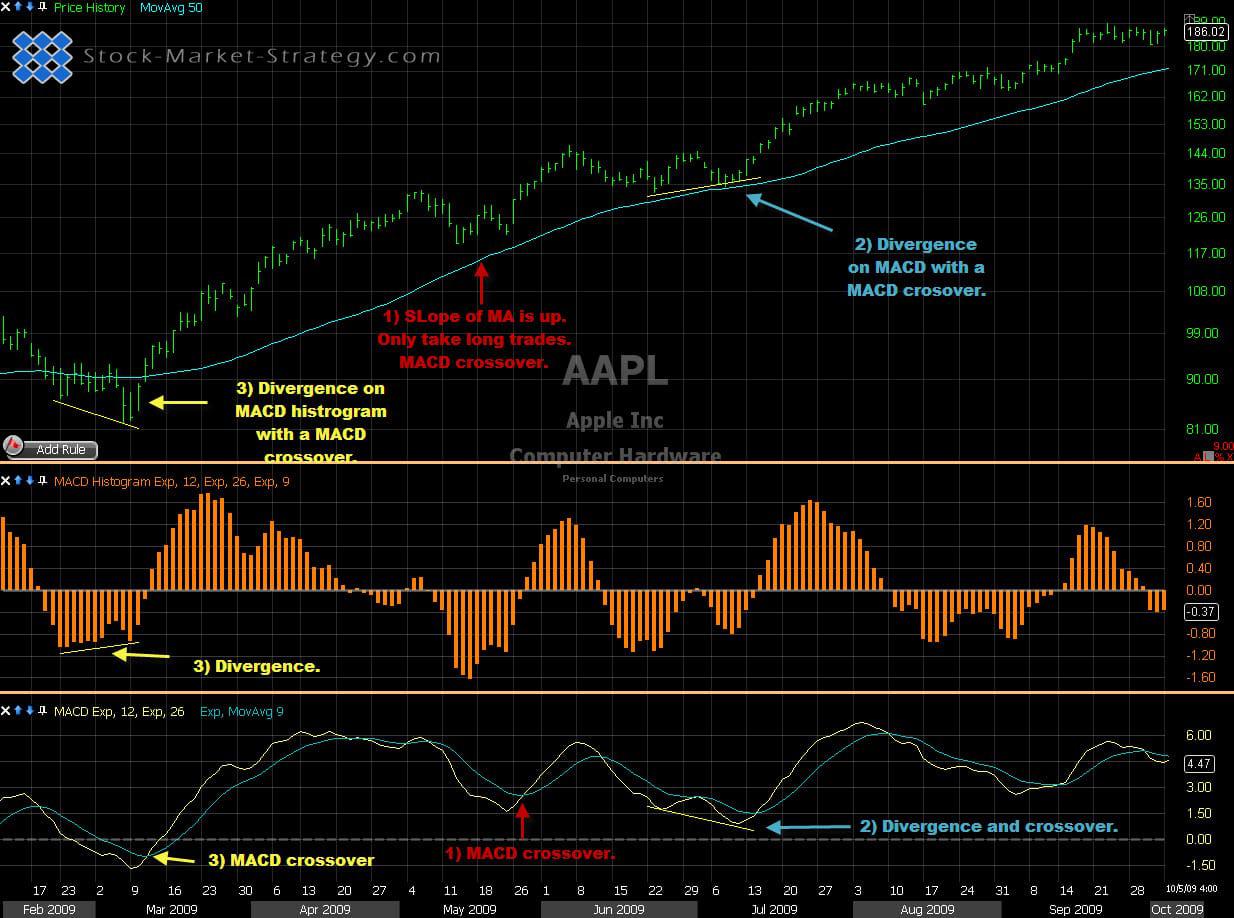
1. You can decide to add some filters in order to avoid the lowest odds trades. We know that the short term trend is up when the MACD is above zero but what about the longer term trend? After determining the major trend you only take the MACD crossover with that trend.
2. Another strong and widely used aspect of this technical analysis is divergence. If a price makes new low but MACD makes a higher low then we have positive divergence. This can signal a stronger bounce and thereby a better MACD crossover signal.
3. The MACD Histogram can also show divergence. If price makes a new low but MACD histogram makes a higher low we have positive divergence. What it tells us is that the momentum (spread between MACD and 9EMA) is smaller on the current move compared to previous moves. After seeing the divergence you wait for the histogram to cross zero. This means that 9EMA has crossed MACD.

Stock trading using MACD - Moving Average Convergence Divergence
Our Implementation
Like with many other indicators I like to combine MACD with some sort of trend-indicator. Such as moving averages. I also looked to the left of the chart to see if we are trending or consolidating. If price is consolidating in a small range then the late entry on Moving Average Convergence Divergence will be useless as my target (top or bottom of consolidation) is probably just around the corner giving me a bad risk to reward.
