We highly recommend and perhaps even urge you to watch the General Tips Video on how to best use this day trading strategy video. It provides some great tips of how to maximize the reward from our day trading strategies videos and more importantly how to minimize risk and losses. Do not jump the gun by skipping the General Tips Video.
The Stochastic Strategy uses 3 very important components which are Stochastic of course but also Support/Resistance and candlestick patterns which is the Hammer and Shooting Star. If you are not familiar with the Stochastic indicator I strongly recommend that you watch our free video on that indicator. In this video we quickly explain what support/resistance is and what the Hammer and Shooting Star is.
Indicator Shows Overbought and Oversold Signals On Your Technical Analysis
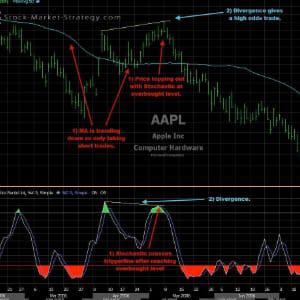
Stochastic shows overbought and oversold levels plotting a oscillator below the chart ranging from 0-100. Readings below 20 are considered oversold and readings above 80 are considered overbought. This is short term only and what any trader should know is that Stochastic can stay oversold or overbought for an extended period of time. It is therefore very important to use this indicator with other tools such as support/resistance and candlestick patterns.
Support/Resistance is one of the most important things in trading. It is a very useful tool used to identify potential reversal points. In this video we use horizontal support/resistance as we believe that this provides more valid support/resistance than dynamic support/resistance such as Moving Averages.
Get all the Components in This Trading Strategy & Make it Work For You!
The last component used in this day trading strategy is the candlestick patterns, Hammer and Shooting Star. You may say they are the trigger signal. The Stochastic and Support/Resistance locates areas where price might bounce but the Hammer or Shooting Star is the signal to enter. It is very important traders do not just focus on the trigger itself as it is only a small part of the strategy.
So a long entry is setup by first locating support/resistance. Draw in your horizontal lines. Never lose track of where support/resistance might come in. Then check Stochastic at those levels. Are there any times where price is oversold at support? This gives you a potential bounce point after a oversold reading. Then wait to see if you get a Hammer. This provides you with the entry as well as a stop which is placed under the Hammer.
Trading with the overall trend will increase the odds of success. Only taking the first setup after a support/resistance is confirmed will also increase the odds because sooner or later the support/resistance will be broken.
Remember that with any day trading strategy it is not only the system itself that makes money. It is knowing when trade. The right market conditions are very important. Here are some general tips on how to avoid some of the bad times to trade: Do not trade during holidays as volume is low and thereby making price subject to sudden moves. Also try to avoid trading around FED announcements as this event can change price rapidly.