The Relative Strength or RS is not necessarily an indicator so therefore is often overlooked. It compares a stock or any other instrument to another stock/instrument and most commonly we compare, for example, a stock to a market index such as SP-500. Don't confuse this tool with Relative Strength Index - RSI which is a completely different indicator. (See our page on RSI)
Indicator Explained in Detail
You simply divide the stock price with SP-500 price and you get a number used for plotting a graph beneath the stock. Relative Strength - RS can be calculated and used on any time frame, from intrabar to monthly charts and this calculation is based on closing price action.
When the RS is dropping it means that the stock is fairly weak compared to SP-500 and when RS is climbing the stock is relatively strong compared to SP-500. Don't confuse a falling RS with a falling stock price. You can easily have a rising stock with a falling RS but it just means that the stock is climbing moderately less than SP-500.
There are Four Scenarios When Using RS:
- Price ↑ + RS ↓ = Stock climbs less than SP-500
- Price ↑ + RS ↑ = Stock climbs more than SP-500
- Price ↓ + RS ↑ = Stock drops less than SP-500
- Price ↓ + RS ↓ = Stock drops more than SP-500
You can use any technical indicator and chart analysis on the RS, such as a moving average or double top/double bottom.
RS can give you a heads up on rapid change in the price which is a main reason traders use RS. Another reason is that traders prefer buying leaders in the market so buying a stock that shows relative strength makes sense. There is no reason to buy a lagging stock which is only going up because the market is dragging it up.
Tips and Ideas:
There are various uses of RS in trading. The first use is for entries:
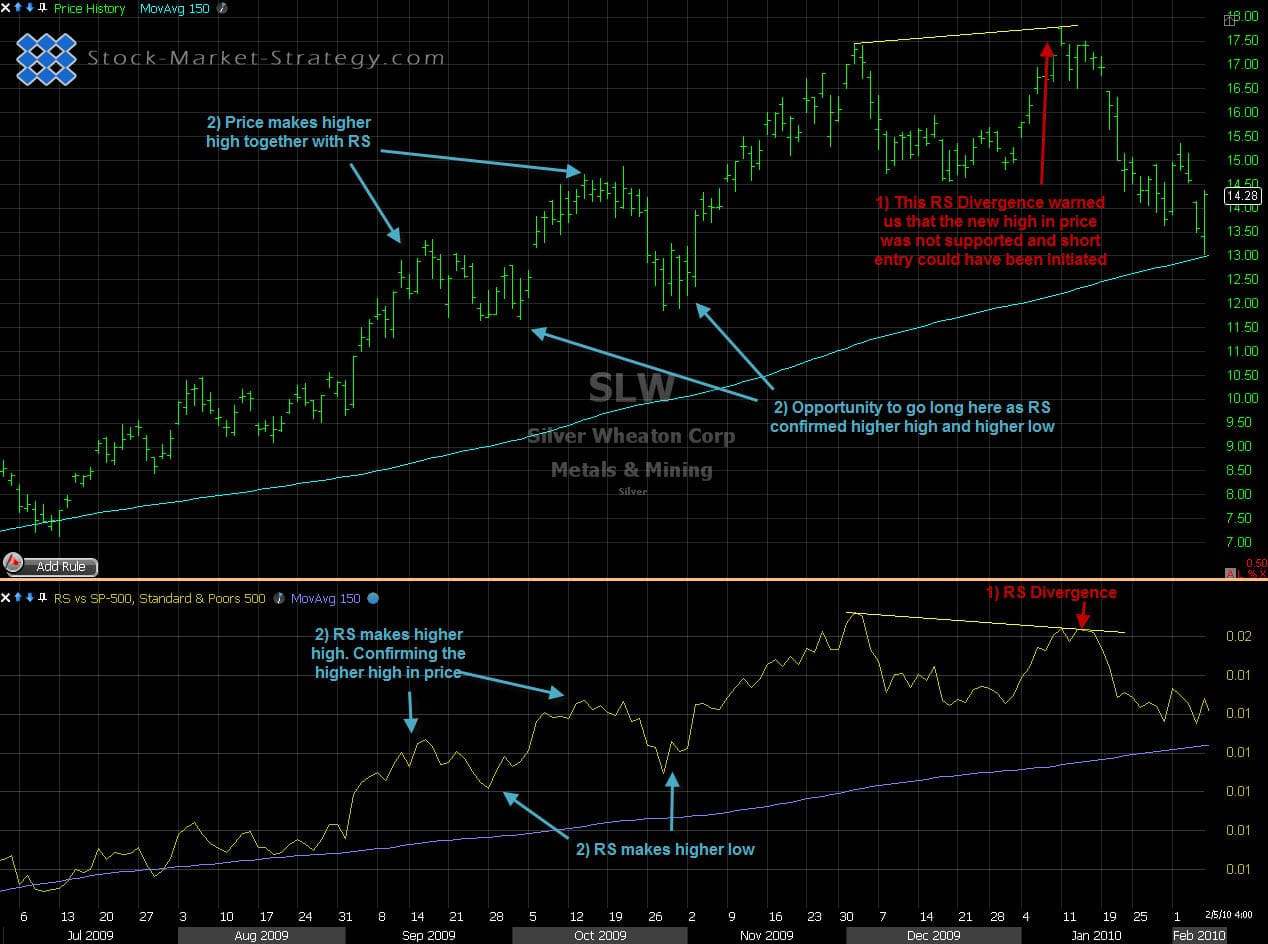
- When using RS for entries, a good idea is to look for divergence as this is when price makes a higher high but the RS makes a lower high. This gives the trader extra evidence when going short. Look for your signal knowing that the stock is relative weak as an entry could be a double top (with a slight higher high). The RS has already told us that it does not support the new high.
- Another way using RS for entries is to use it for the analysis of your entries. Look for a relative strong stock and an uptrend in that stock. This tells you that it is climbing faster than for example SP-500 and this increases the odds for your long entry.
Using Relative Strength for high odds trades
This Indicator is also a great tool for profit taking:
- Divergence can also be used for profit taking. When the stock makes a higher high and relative strength makes a lower high then it signals that the stock is no longer stronger than the market and profit taking is a wise choice.
- As explained earlier, many traders add indicators to RS. By adding two moving averages to your RS you get a great tool for profit taking. If you are in a trade and your shorter term moving average is crossing down through your longer term moving average then it is time to take the profit. It means that your stock is performing worse than the market.
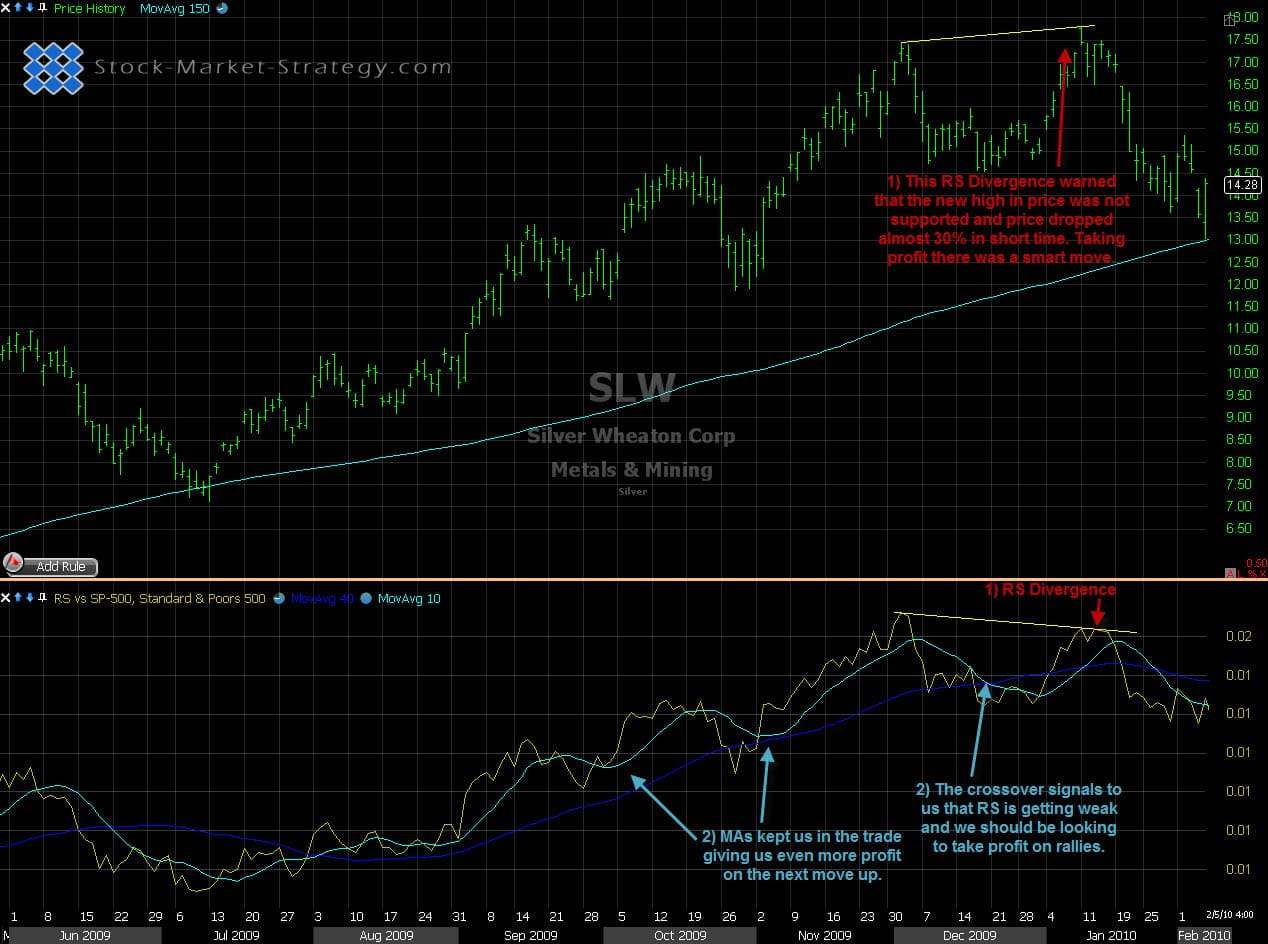
Using Divergence to take profit
Our Implementation
Our main rule is that we only focus on two of the above mentioned scenarios. We focus on the two where the stock and relative strength drops together and where the stock and relative strength climbs together. We cannot see any reason to short a falling stock which shows relative strength like we cannot see any reason to buy a rising stock which shows relative weakness.