Because the bands will contain most of the price action, a move to the upper band will be seen as overbought and vice versa.
What length should I choose?
John Bollinger recommends a 20 period moving average. This is based on daily charts so intraday traders should not necessarily follow this. It is really about testing which settings are best. The more price action contained by the bands the better. So play around with different lengths and gain an understanding of what works for you personally in trading. By finding the right length you have great potential reversal points at the bands.
Tips and ideas
Bollinger Bands can be used for many things but my absolute favorites are reversal points and the prediction of a big move.
1. Reversal points - Bollinger Bands are great at predicting possible future turning points. Bollinger Bands, with the correct settings, contain more than 90% of price action selling at upper bands and buying at lower bands which gives a good risk to reward. As with everything else in trading, it's not that easy so I personally make two rules:
b. In sideways price action (a flat MA) I trade both higher and lower bands but I do keep an eye on the width of the bands. This is because in sideways price action, targets are always placed at resistance so it's important that the bands are not too tight in order to give a reasonable risk to reward.
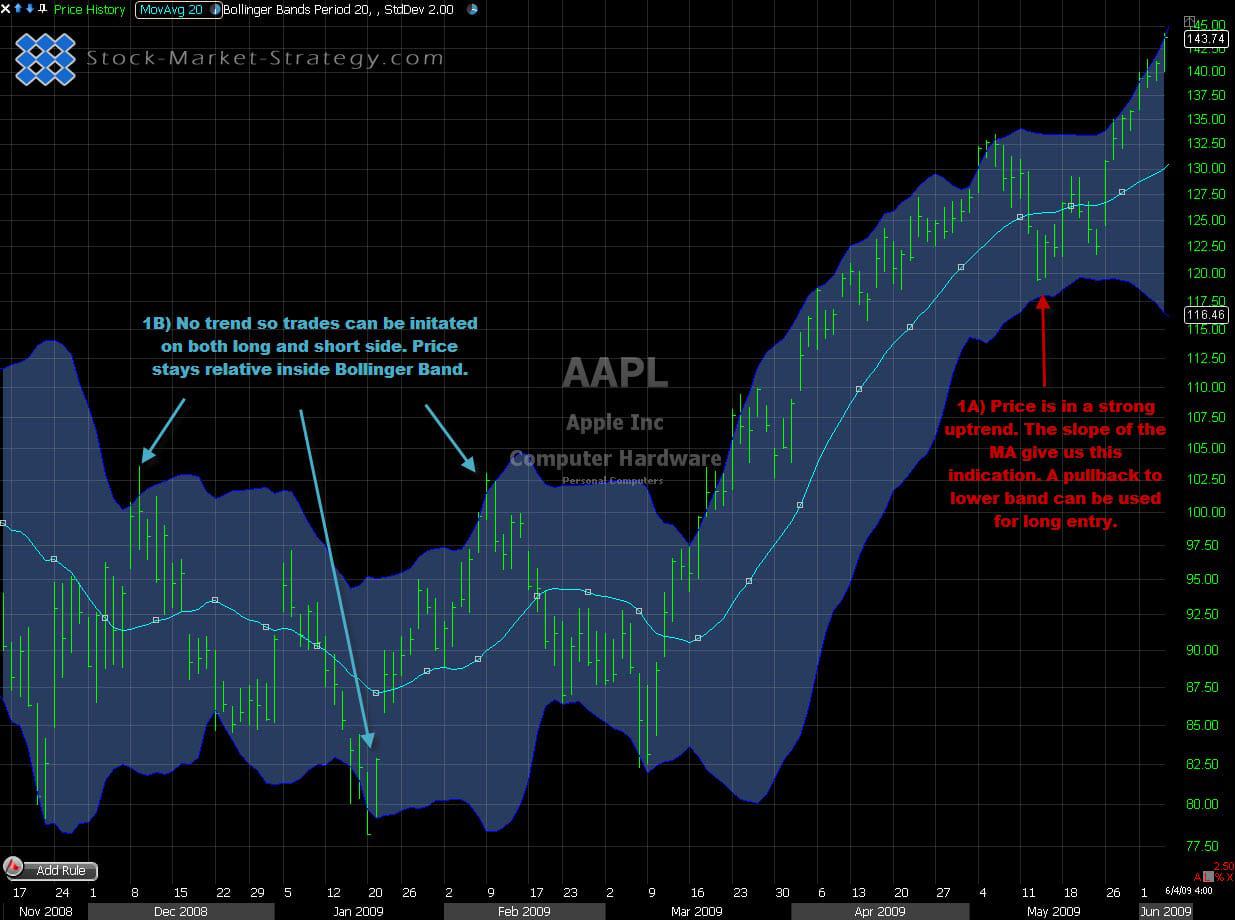
a. In an uptrend only trade the lower bands and in a downtrend only trade the upper band. This is because price action doesn't necessarily need to reverse at the band as the band could keep climbing with the price action. Therefore I see the higher odds setup as going with trend and buying the pullback to lower band and in a downtrend I would be selling the rallies.
Using Bolling Bands to spot oversold and overbought levels
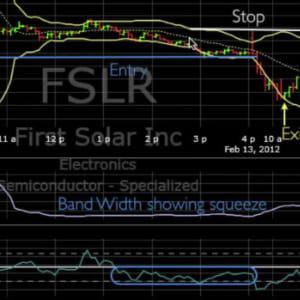
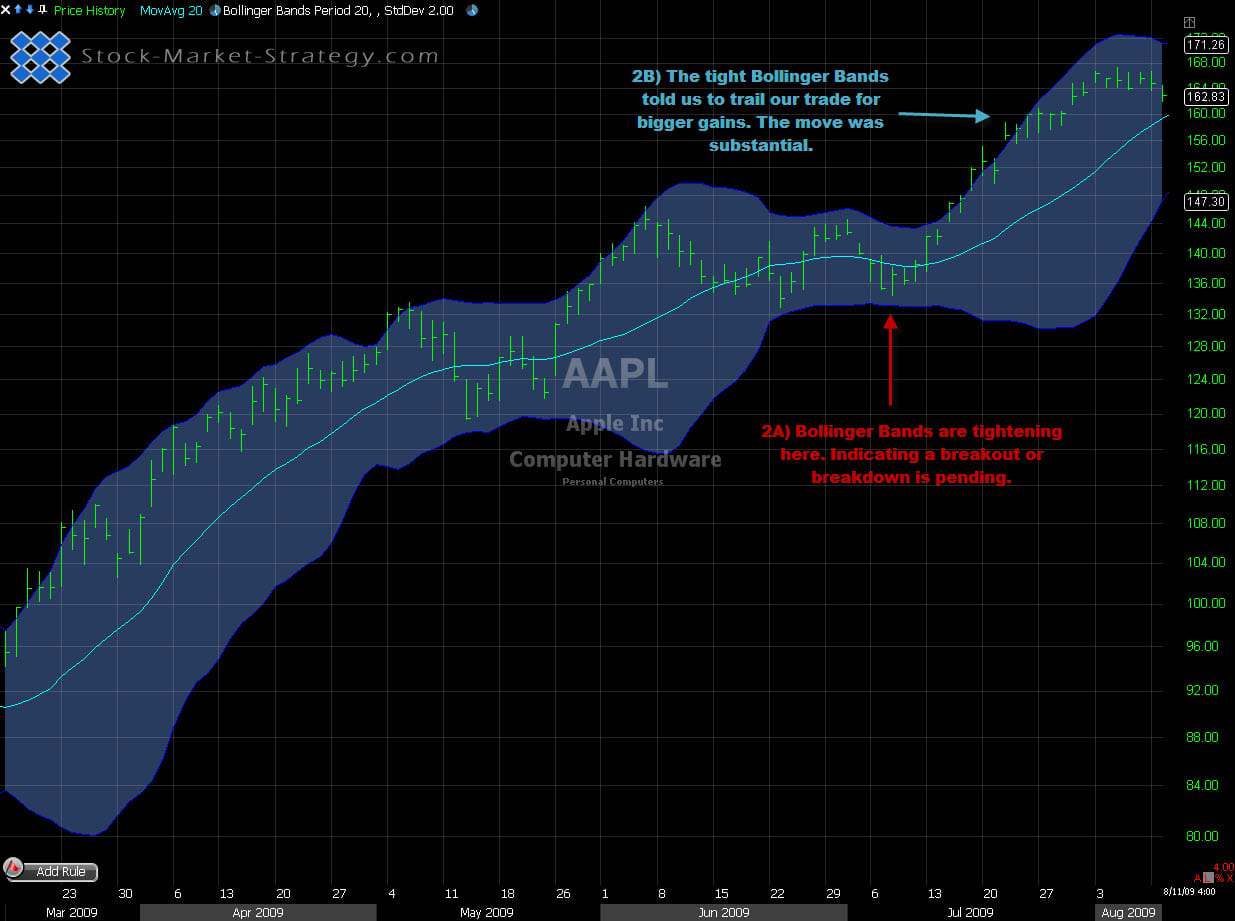
2. Prediction of a big move - When the bands contract, it shows low volatility and what normally happens after that is a fast and strong move. The problem is that Bollinger bands don't tell us which direction the move will be. So what can we use it for? Well, several good things:
a. Whenever I see tight bands I get ready for a breakout or breakdown trade either when breaking a trend line or support/resistance. Because the bands are so tight I consider the trade worth taking as it will likely give me more than one to one.
b. The tight bands also give me an indication of trailing my position due to the increased odds of a longer sustained move.
Bollinger Bands are great at predicting a strong move
Like with so many other setups you will be bound to see fake breakouts/breakdowns. Some traders actually only take the trades after seeing the fake breakout/breakdown and subsequently benefit from other peoples panic. This will give fewer setups but will have a higher win ratio.
To conclude this indicator explained section, Bollinger bands are a valuable tool for any trader whether a technical indicator-trader or a pattern trader. For example by adding a stochastic together with Bollinger bands you are on your way to establishing a system for buying the pullbacks and selling the rallies.