Bollinger Bands technical indicator measure volatility by using standard deviation away from the average. It places two bands, above and below the average. The values between these two bands give the band width.
During high volatility the bands will widen and thereby making the band width rise. The opposite will happen when volatility decreases, thereby making the band width fall.
The Formula behind Bollinger Band Width and Ways to Trade with it
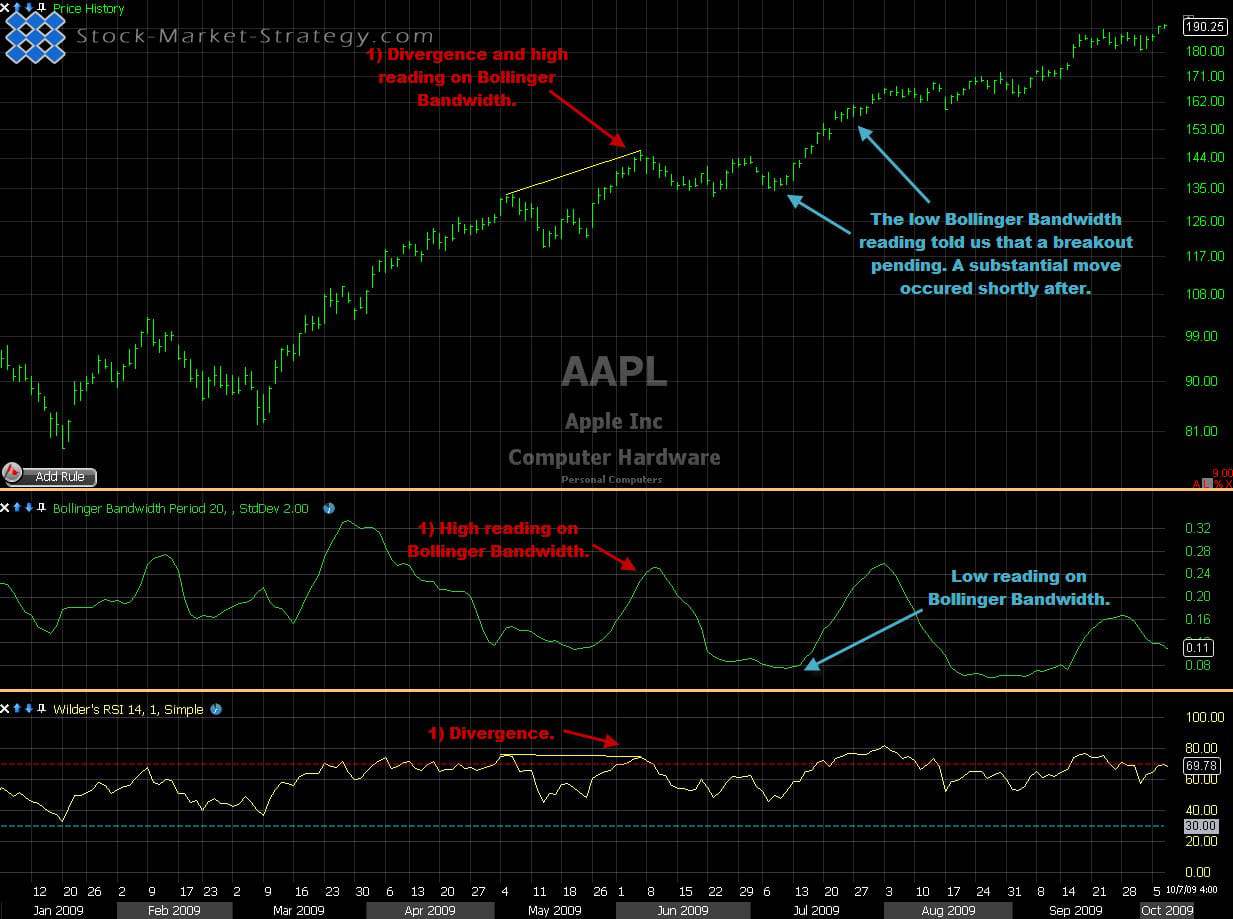
When the Bollinger Band width is very high it can be a sign that the trend is ending soon. You can measure historical band width to compare whether the band width is high. When the band width is at extreme low it can be a sign that price will break out sooner rather than later. However you cannot predict the direction.
Tips and ideas
So now band width has been explained and defined you now need an idea of direction:
1. During a high band width you can look for topping or bottoming price action either using RSI or Stochastic. Additionally look for divergence on the above mentioned oscillators. So if the trend is up and band width is at extreme levels compared to historical highs in the band width you then look at overbought stochastic, alternatively with divergence. This will increase your edge at picking a winning trade.
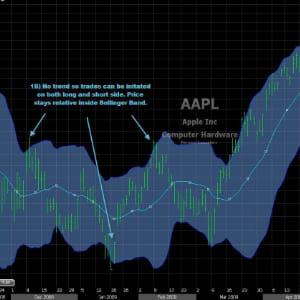
2. During a low band width we expect a pending breakout but we do not know the direction so we have to wait for the break out. You can simply draw trend lines/horizontal lines and wait for close above/below the lines.
Using Bollinger Band Width to predict a strong move in the stock
Using the Techincal Analysis-Our Implementation:
I personally prefer going with the trend so I like trading the low band width with a breakout versus the top/bottom picking with the high band width reading. That means I only take the breakout if it is with the trend. My favorite low band width trade is when the price action looks like stair steps up/down and I enter when the new stair step begins.