Ascending Triangles are bullish chart pattern signals that are considered continuation patterns when you have determined the direction of the trend prior to the Ascending Triangle so it is particularly important to do an analysis on this chart pattern.
The Ascending Triangle patterns do not vary in their development because they need at least 2 higher lows and 2 equal highs. The trendlines will then have a point of reference to be drawn from to create the Ascending Triangle which is also the area that we call the support resistance area.
This Pattern is a Continuation of Trend. Do Not Ignore This!
One of the good things about this chart pattern is that when you are learning how to trade, this one is one of the easier patterns to identify when conducting your chart analysis as it has a distinctive overhead resistance area. Like with any continuation pattern this is the period in the price action where the stock needs to take a break or consolidate before continuing on its prior trends journey.
How to Identify This Tradable Pattern
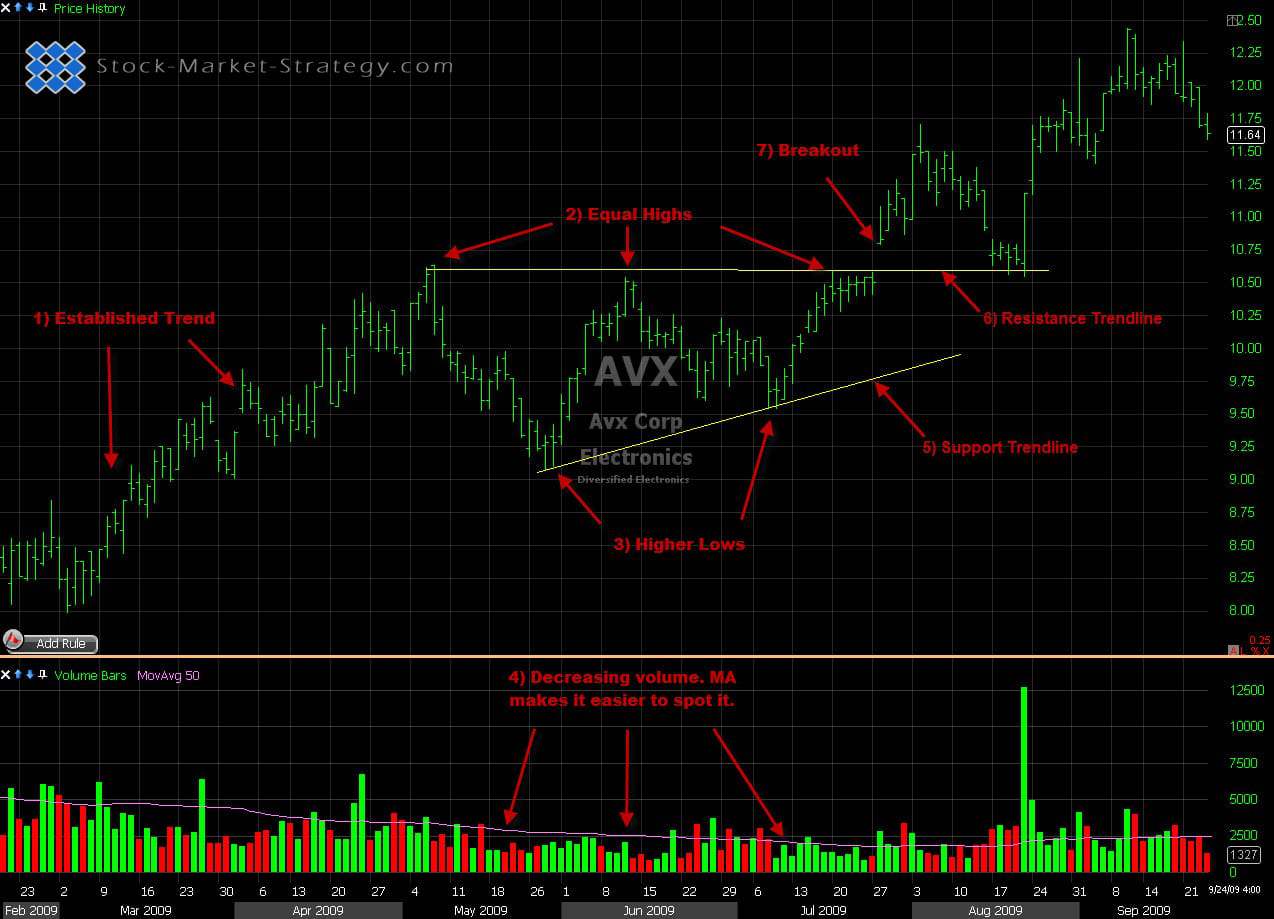
- Establish Trend - As with any other continuation pattern there must be an established trend to continue. Ascending Triangles have to be formed after an established uptrend.
- Equal Highs - After the trend has been established and price has started to make equal highs these are where we identify the positioning of the overhead trendline. For this to happen there must be at least 2 equal highs for reference points for the trendline to be drawn.
- Higher Lows - Now that we have 2 over head equal highs there must also be retracement levels which also require a minimum of 2 reference points for the trendline to be drawn. These higher lows give support to the price action and give the shape of the Ascending Triangle.
- Volume - What is noticeable with Ascending Triangles as the price range gets narrow, the volume also decreases. There are also characteristics that you should look of for with volume at the break out point.
- Support - The trendline that is supporting the higher lows
- Resistance - The trendline that is containing the equal highs
- Breakout - This is the confirmation that price action will continue to the upside breaking the overhead resistance trendline. Confirmation still needs to be that the price closes outside the resistance area. You can often see price returning to test the resistance trendline but it does not necessarily have to. Also you can combine the breakout confirmation with a volume surge for extra confirmation.
**Breakout Confirmation- A very important thing to remember is to only take the breakout if it occurs in the same direction as the trend prior to the pattern. This is because as previously mentioned it is a continuation pattern. For example, a breakdown in an ascending triangle in an uptrend could easily just turn into a rectangle / sideway price action resulting in the trader being caught on the wrong side.
Trending Trading using Ascending Triangle
Styles Traded - Ideas on How It can be Traded:
- Entry - Price breaks resistance area and closes above. This has a tight stop loss due to the narrowing of the price action but is more confirmation that it's continuing upwards.
- Might Miss - Price retests the resistance trendline which now becomes support area.
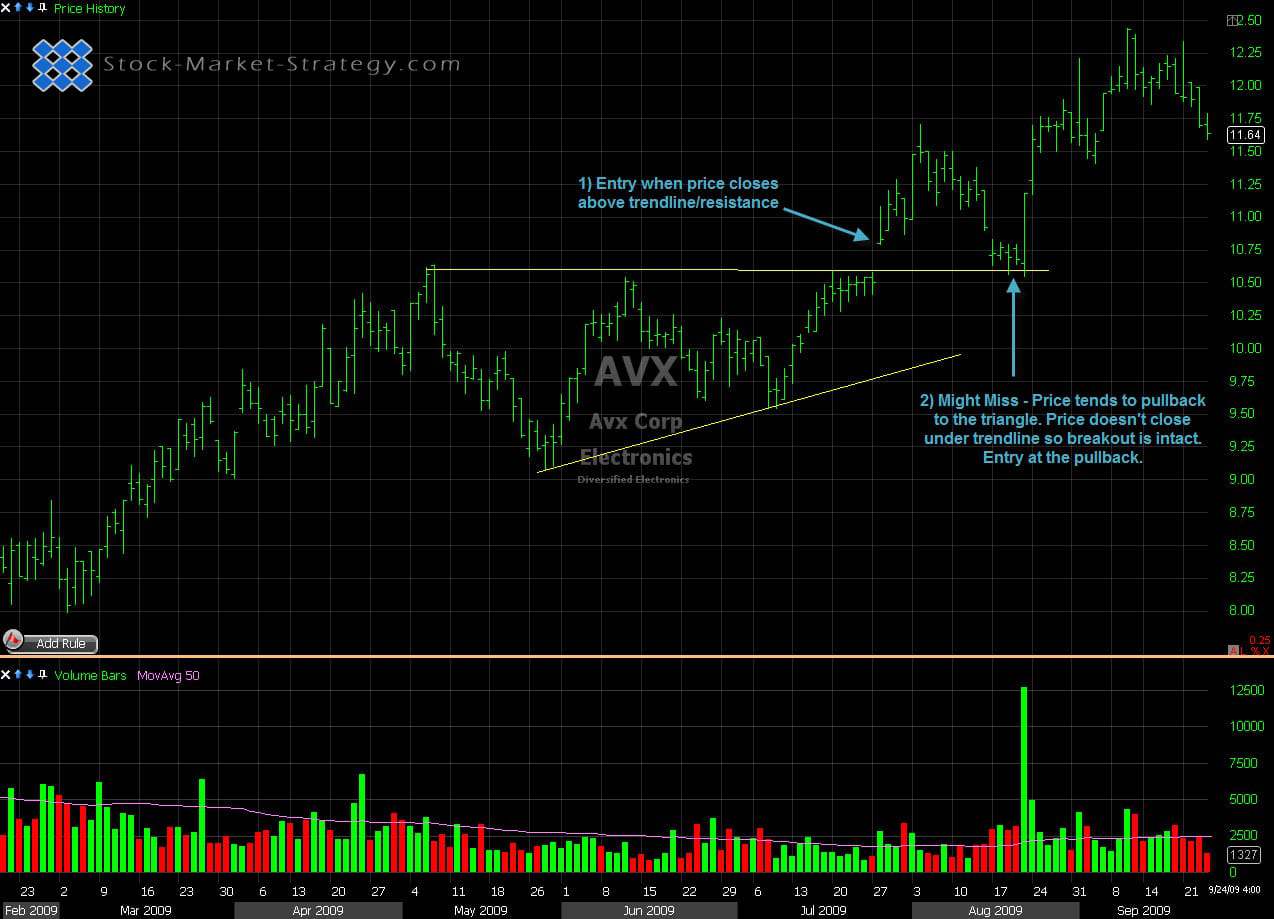
Entry opportunities when trading a Ascending Triangle
All trading style entries have their strength and weaknesses and will come down to the trading style of the individual trader and their tolerance to money management (R&R).