Apply Relative Strength Index (RSI) to Your Trading Charts
RSI was invented by J. Welles Wilder and first introduced to the public in 1978. This indicator is one of the more popular ones in trading despite being relatively new. RSI measures momentum by comparing the extent of the stock's recent gains and losses by transforming this info into a number between 0-100. Many traders confuse this indicator with relative strength between two stocks. RSI has nothing to do with that though the name implies it.
Most Used Settings
RSI is formed by using the average gain/loss over a predetermined period which J. Welles Wilder recommended a period of 14. This is probably the most used setting and since the invention of RSI we have been introduced to intraday trading so we are seeing many different settings. Scalpers might use a lower setting of 7 periods but you have to figure out what your trading style is and then back test the setting to see what is best.
RSI is plotted as a number between 0-100 with overbought and oversold levels at 70 and 30. Wilder recommend these levels but I have seen many traders preferring 80-20. This will result in fewer but higher odds trades.
Probably the most used technique when using relative strength index is a crossover of 50, either to the upside or downside. When above 50, the stock has a bigger average gain then average losses but the opposite is true when RSI is under 50.
Another great use of this technique is the overbought/oversold levels. Many traders will be looking to enter the trade at these levels if it's with the trend. It is important to take notice of the trend as RSI can stay either overbought or oversold for an extended period of time.
Many traders also use the overbought and oversold levels for either tightening their stops or taking profit.
Tips and Ideas
Now we have an idea of what the RSI is telling us and how to use RSI to increase our odds for success trading the stock market. Some ways to use it are:
1. Combining both the overbought or oversold level with a crossover of 50 increases the odds of success. By only taking crossover after hitting the extreme levels will ensure that your stock has enough momentum to give you a decent risk to reward.
2. Divergence is another great way to increase your odds for success. By combining the above mentioned entry with divergence you are increasing your odds for a fast profit. If price makes a new low but RSI makes a higher low it tells us that momentum to the downside is drying up and a significant bounce can occur any time now. Wait for confirmation of the 50 crossover and you have yourself a high odds trade.
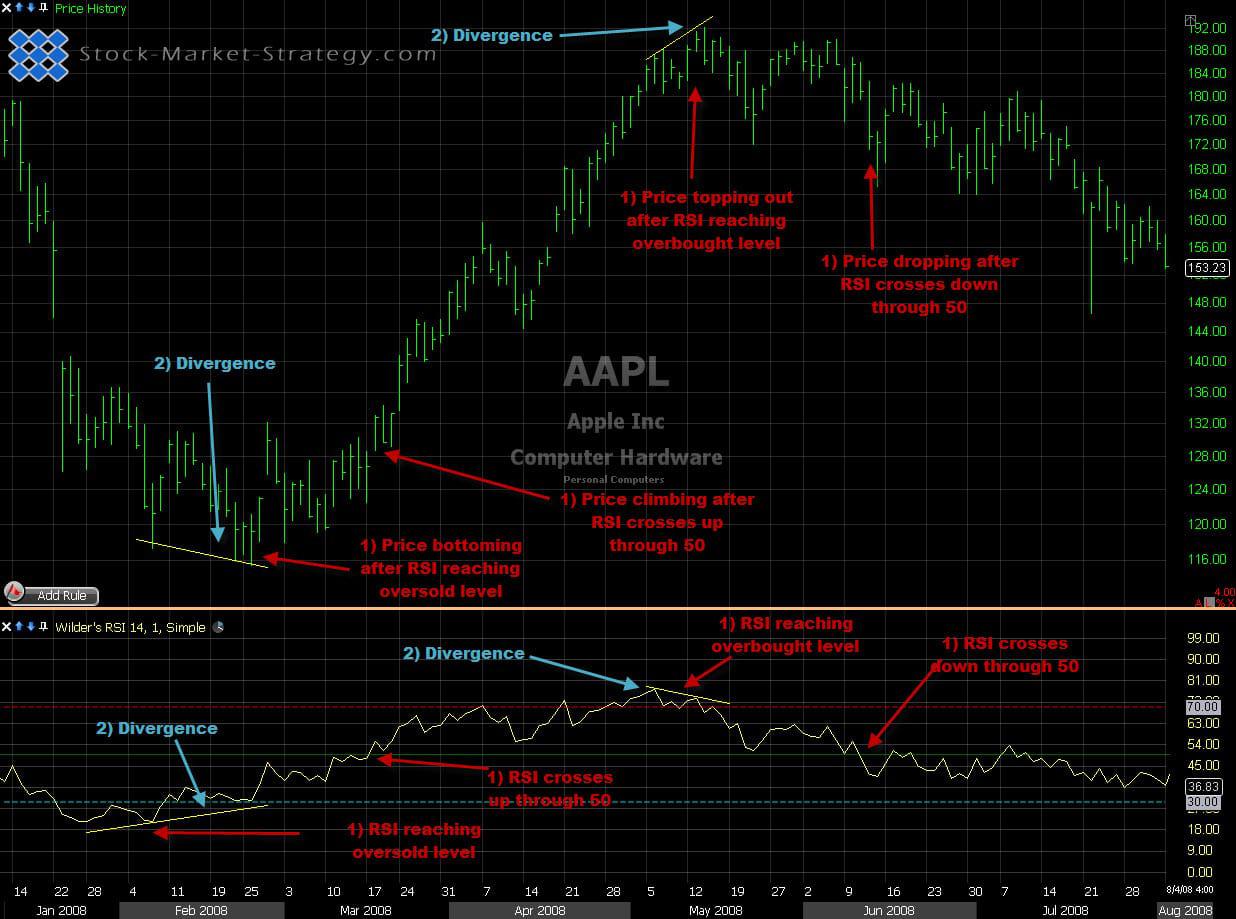
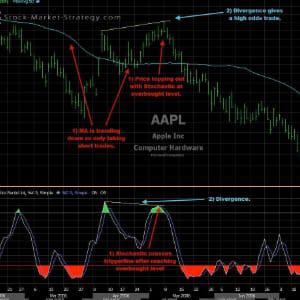
Buying oversold and selling overbought using RSI
Our Implementation
RSI is a great momentum indicator but it has its weaknesses as it does not tell you if you are going against the longer term trend. I therefore always add a moving average to determine the trend and then take the RSI signals in alignment with the moving average.