Keltner Channels were first introduced by Chester W. Keltner in his book "How To Make Money In Commodities" and since then Keltner Channels have evolved into what we use today. Don't get fooled by the title on the book. This overlay can be used on any market such as stocks, Forex or any other instrument that you may want to trade.
Trading the Channel Learn More About This Indicator
It's a little similar to Bollinger bands but calculated by using average true range (ATR) and a simple moving average (SMA) which is also called midpoint. This means that the upper and lower bands follow each other like an envelope around price.
What length to choose?
So, how do we trade using the Keltner Channel? As with Bollinger bands, it really is trial and error. Test what length suits your trading style and market. The most common length is a 10 or 20 SMA with a 2X of 10 period ATR.
Tips and ideas
The Keltner Channel has two functions, one similar to Bollinger Bands about showing possible reversal points and one showing strength/weakness.
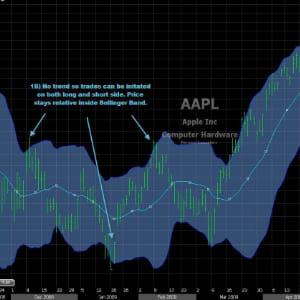
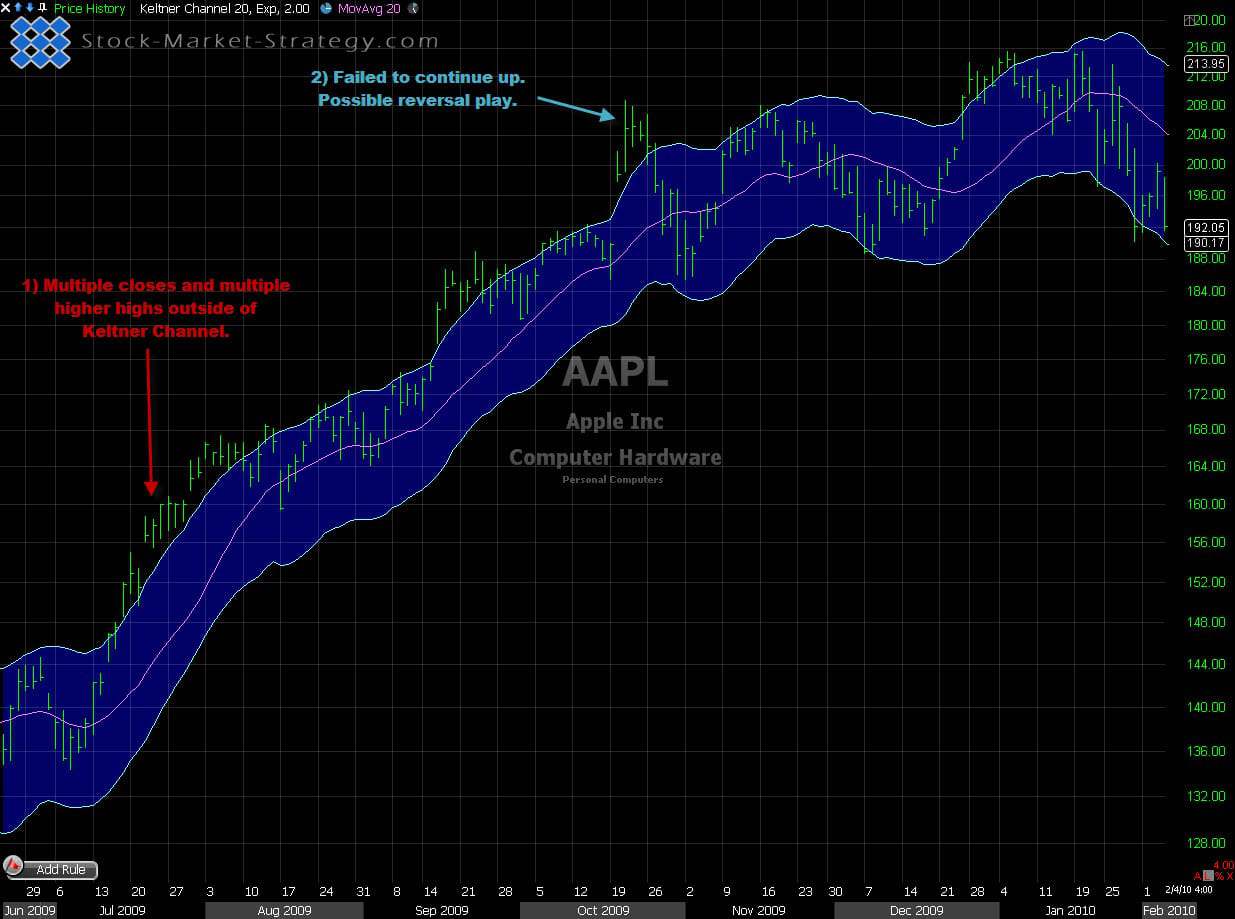
1. Possible reversal points - When the price closes outside the upper band it's considered overbought and might return to "normal". This strategy is best used in sideways price action. In trending markets price can stay overbought/oversold for a long time.
2. Showing strength/weakness - Multiple closes with higher highs outside upper Keltner could indicate the beginning of new move/trend. A pullback to midpoint would then be a good place to look for entry. The opposite can be considered for shorts.
Trading the channel using Keltner Channels
Our Implementation
Keltner Channels are best used with other indicators or candlestick patterns. As a standalone it's relatively "weak". My personal preference is in sideways price action by buying the lower band and selling at the upper band and I normally combine it with reversal candlestick patterns.