Descending Triangles are bearish and are usually found in downtrends in stocks as continuation chart patterns. Where the ascending triangle appears flat at the top and the bottom with an upward slope, the descending triangle appears flat at the bottom with the hypotenuse sloping down.
This type of triangle pattern needs, at minimum, 2 lower highs and 2 equal lows with a point of reference on the trendline from which a descending triangle can be created, which is also called the support resistance area.
This Chart Pattern Is a Bearish Continuation Pattern
Descending triangles can be quickly identified when conducting chart analysis through their distinctive low support area as with any continuation chart pattern, the stock needs to take a break or consolidate before continuing. To qualify as a descending triangle and a continuation pattern there must be a few stipulations met first:
Steps to Identify:
- A trend must already exist - descending triangles have to be formed after an established downtrend.
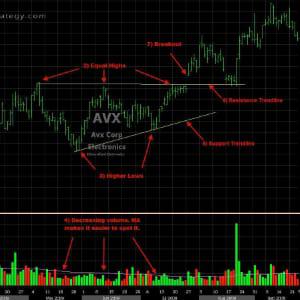
- Two equal lows - once the trend has been established and the price is making equal lows, we can identify the positioning of the support trendline. This can only happen after at least 2 equal lows and then reference points for the trendline can be drawn.
- Two reference points - now that we have 2 equal lows there must also be retracement levels which also require a minimum of 2 reference points for the trendline to be drawn. These lower highs acts as resistance to the price action and give the shape of the Descending Triangle.
- Volume - as the price range with the triangle becomes narrow the volume decreases before increasing dramatically as price breaks out.
- Resistance - The trendline that is containing the lower highs
- Support - The trendline that is supporting the equal lows
- Breakdown-here you will get a confirmation that the price action will continue to break down as the support trendline is taken out. The price will often return to test the support trendline now appearing to act like resistance and you can combine the breakdown confirmation with a volume surge for extra confirmation.
*Breakdown Confirmation-it is vital to remember to only take the breakdown if it occurs in the same direction as the trend prior to the pattern as it is a continuation chart pattern. For example, an upside breakout in a descending triangle in a downtrend could easily just turn into a rectangle / sideways price action resulting in the trader being caught on the wrong side.

Selling Short using Descending Triangle
- Entry - Price breaks support area and closes below. This has a tight stop loss due to the narrowing of the price action but is more confirmation that it's continuing downwards.
- Might Miss - Price retests the support trendline which now becomes resistance area.

Ways to enter a short trade using Descending Triangle
All trading style entries have their strength and weaknesses and will come down to the trading style of the individual trader and their tolerance to money management (R&R). A descending triangle is the bearish counterpart of an Ascending Triangle.