The Commodity Channel Index - CCI technical Indicator was created by Donald Lambert and was originally used to identify cycles in commodities but works just as well in the stock market or Forex Market. The reason for creating this technical indicator was that Lambert (as well as many other traders) believes that every commodity or stock moves in cycles where the high and low is established within a fixed period.
Trade using the CCI Technical Indicator
The CCI Indicator is one of the more advanced indicators when it comes to the calculation and this is one of the reasons that the popularity of this indicator has risen exponential in conjunction with the increased use of automated charting packages.
The calculation is quite complex but by dividing it up in several bits it's easier to understand the theory behind the indicator. This is important so the trader knows exactly what Commodity Channel Index tells him.
Recommendations from the creator:
Lambert recommend using 1/3 of the cycle time (High-Low or Low-High) as the average setting. So if the cycle is 30 days then he would use 10 for the calculation of CCI.
- Typical Price - TP is (High+Low+Close) / 3
- 10 Simple Moving Average of The Typical Price - SMATP is the average of TP
- Mean Deviation - MD is (SMATP - TP for every last 10 bars) / 10
After the above calculation and by using a Constant 0.015 we can now calculate the CCI
- CCI is (TP - SMATP) / (0.015 X MD)
Lambert is using the Constant 0.015 so that his values of +100 and -100 would contain approximately 70-80% of the CCI. A shorter CCI will result in closer to 70% of CCI contained whereas a longer CCI will result in closer to 80% contained.
Lambert focused on movement above +100 and below -100. He considers a move above +100 a buy signal as the Commodity Channel Index tells him that the commodity or stock is in a strong uptrend. A move below -100 is a sell signal as CCI indicates that the commodity or stock is in a strong downtrend.
Tips and ideas
We now know how Lambert wants us to use the CCI for entries but can we do better than that?
- Like with any oscillator it is wise to add a filter to avoid taking low odds trades. Add a moving average to determine the trend of the stock and then only take the CCI signal which is with that trend.
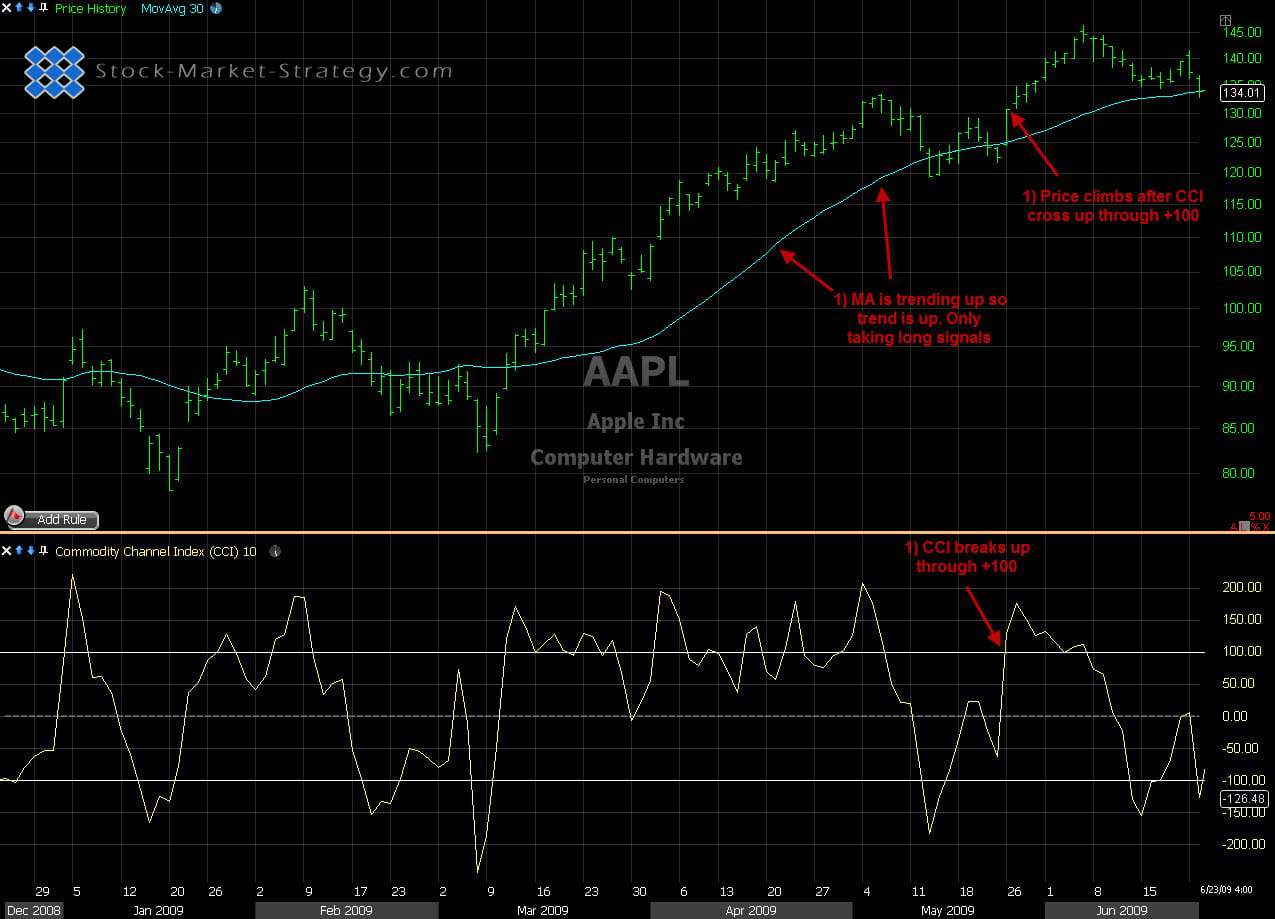
Trend trading with Commodity Channel Index
Since the introduction of CCI traders has discovered various new ways to trade using the indicator.
- Some traders use a CCI above +100 and under -100 as overbought and oversold. CCI crossing down under +100 to fulfill the sell signal and CCI crossing up through -100 to fulfill the buy signal. To this signal you can add divergence. If a price makes new low but CCI makes a higher low then we have positive divergence. This can signal a stronger bounce and thereby a better CCI oversold signal.
- Also some traders draw trendlines on CCI and use the break as entry signal. Again, divergence can used to improve the signal of the trendline break. Only take trendline breaks after seeing divergence.
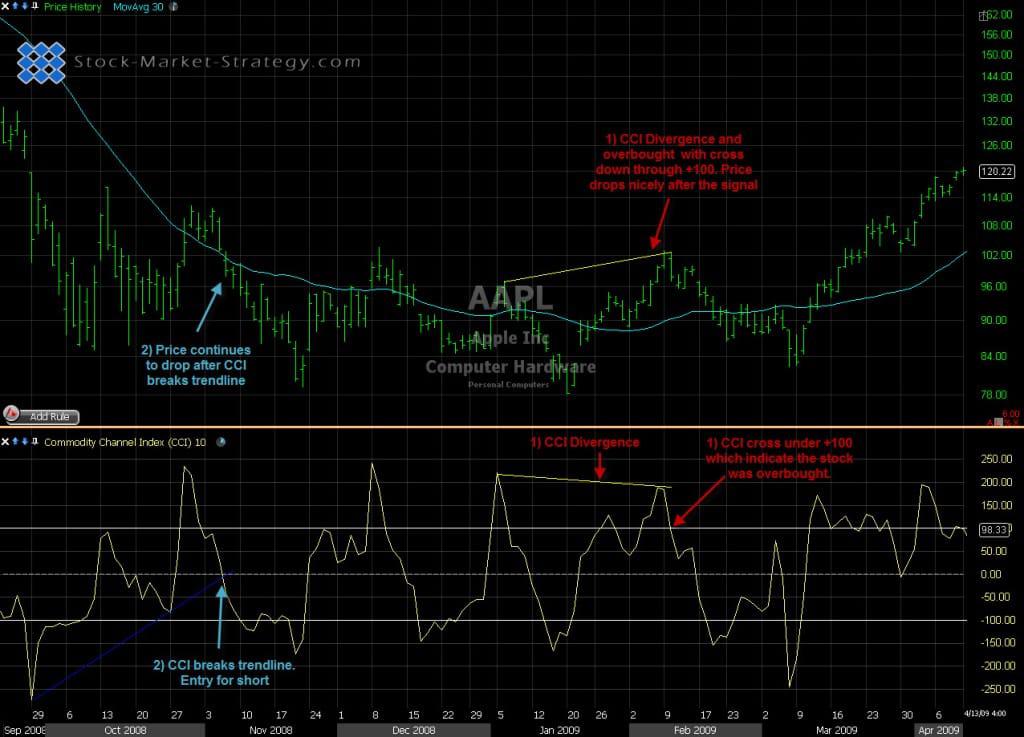
Divergence on Commodity Channel Index
Our Implementation
Because I like to add a moving average and go with the trend I find that using CCI as overbought and oversold works better than Lambert's style of buying "breakout" when CCI crossing up through +100.
I do also trade using the Commodity Channel Index during sideways market but as there is no trend to help with selecting the highest odds trade I like to add divergence to my trade at existing support/resistance areas.