The chart pattern known as a Double Bottom is essentially a mirror image of Double Tops and they still alert us to the major factor that the price action is about to change direction (reversal pattern) but this time from a downtrend to an uptrend.
Learn About One of the Most Powerful Reversal Signals!
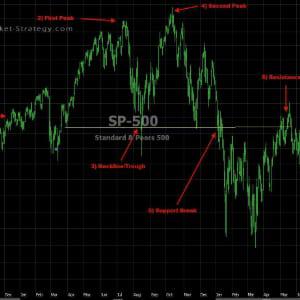
Double Bottoms are formed after an extended downtrend and price action starts to pause then trades in what we call a trading channel. The double bottom can be visualised when you analyse your chart as there are two fairly equal consecutive troughs (bottoming pricing action) and a peak in the middle.
As we progress through our education examples you will be able to see that there are a few variations of Double Bottoms which we use and analyse for shorter and longer term trading in our professional trading roles. Many potential double bottoms can form along the way down, but until key resistance is broken, a reversal pattern cannot be confirmed. To help clarify, we will look at:
Key Points in Formation
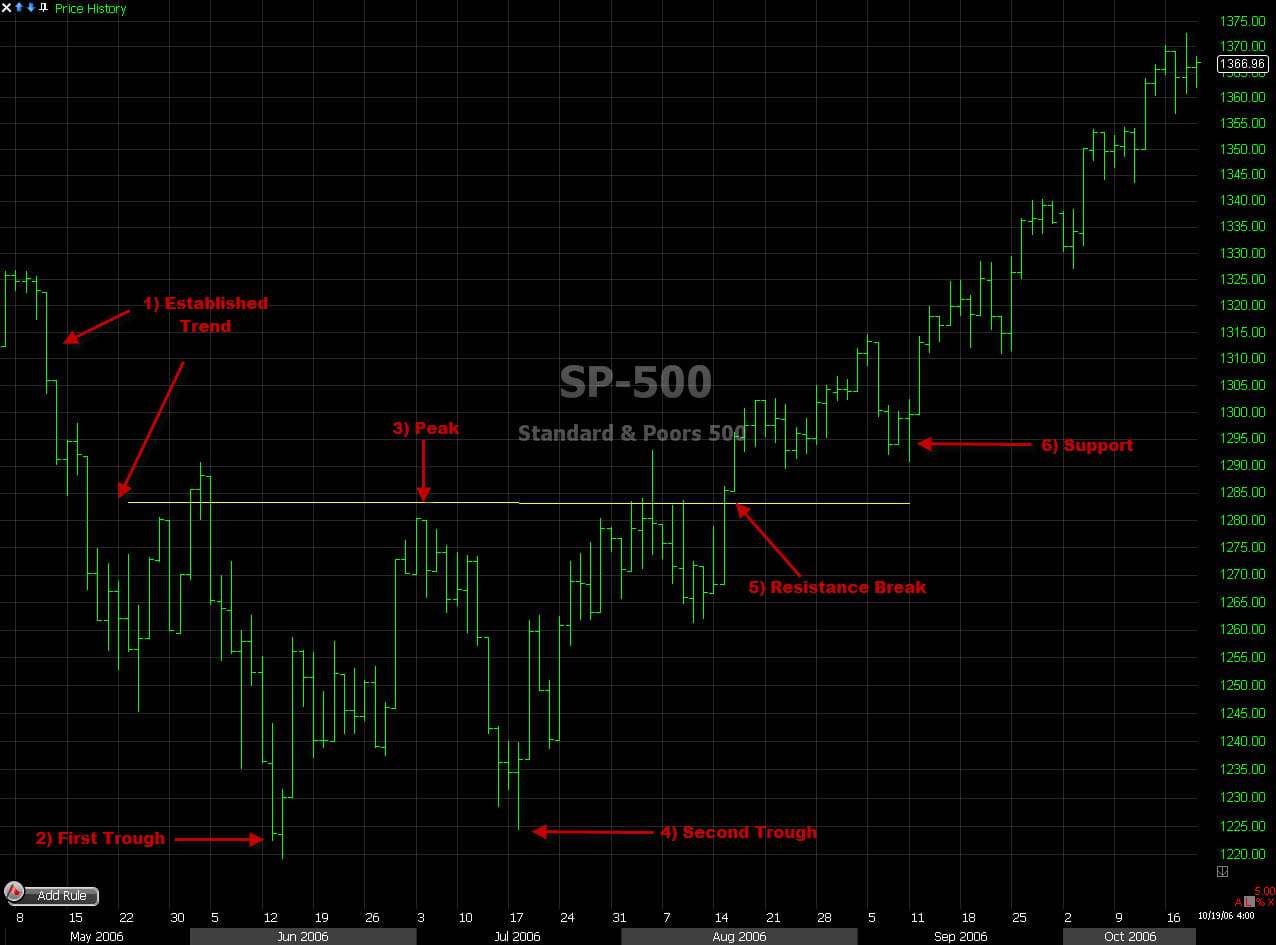
- Establish Trend - As with any other reversal pattern there must be a long term established trend to reverse as Double Bottoms have to be formed after a significant Downtrend.
- First Trough - This trough marks the lowest point of the price action after the significant downtrend and you can occasionally see price action testing in this area before creating the neckline/peak.
- Peak - After the first trough has been rejected and price action starts retracing back to an area of resistance, you will sometimes see a decline in demand which is shown in the volume.
- Second Trough - The price action can now start to test the price of the first trough seeing that the area of resistance has now been created. We believe here at Stock-Market-Strategy that it is down to the choice of the individual trader on what the price action should be but there are certain analysts that require price action to be within 3% either side of the first trough price.
- Resistance Break - As the second trough has been formed and the price has been rejected, price will advance to the resistance area of the peak. As the channel has normally been created over a 2 month period, the peaks resistance area is likely to be tested a few times before breaking. Once the resistance has been broken and the price has closed above resistance then we can be sure that the pattern is confirmed.
- Support - Broken resistance becomes potential support and there is a high possibility that it will be tested by the price and rejected. It is now that you should either exit all short positions from previous downtrend or enter your long position in the stock market.
How to spot the double bottoms chart pattern
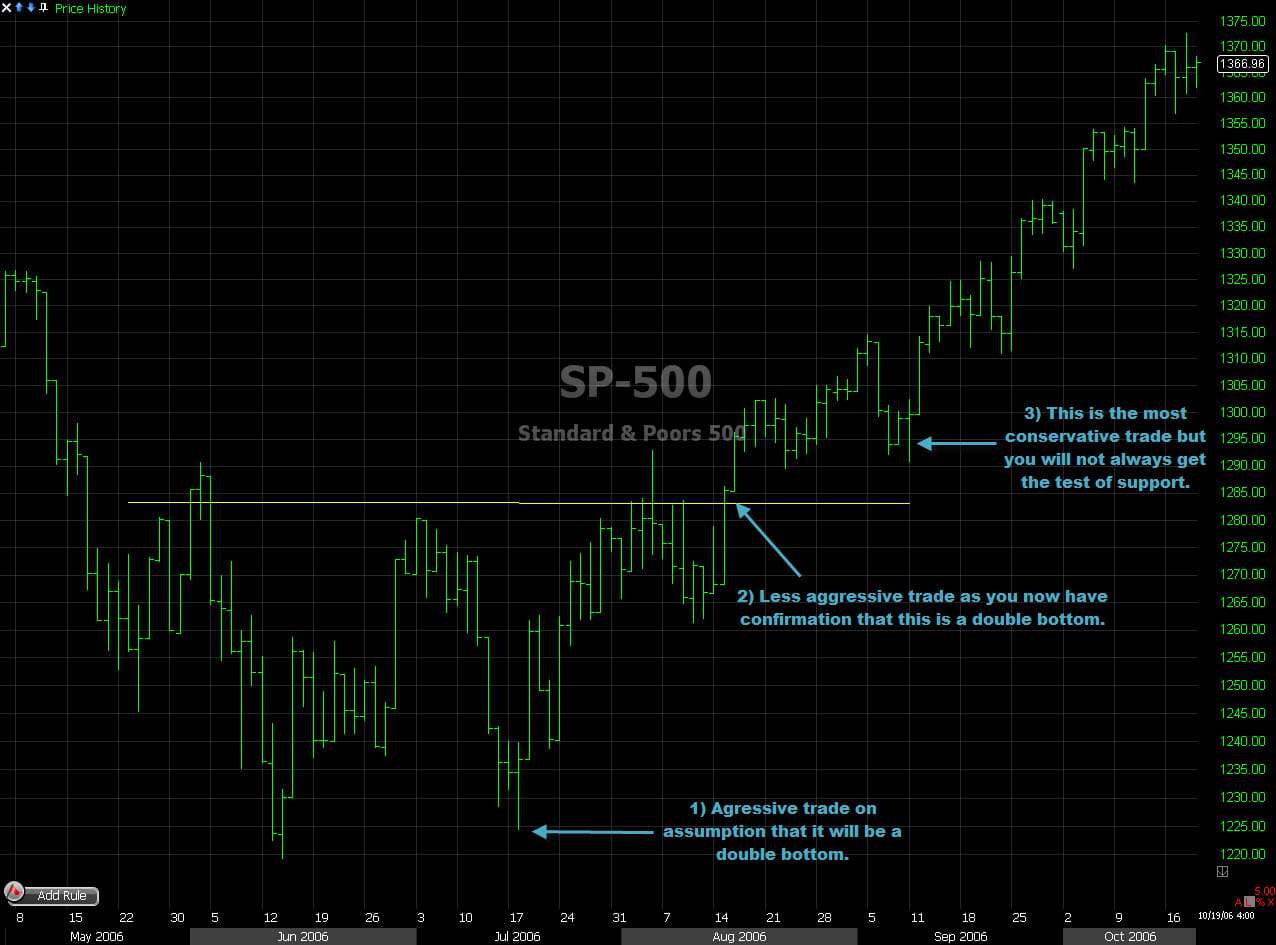
Styles Traded - There are Three ways in which it can be Traded:
- Aggressive - This is when the price action of the second trough reaches the price level of the first trough. This is considered a low odds trade and you will be stopped out more often.
- Less Aggressive - The price breaks the resistance area and closes above. There is a bigger stop loss but is more confirmation that the price is on it's way up.
- Might Miss - Price retests the resistance area which is now the support area.
How to catch a trend reversal using the double bottom chart pattern
All three trading style entries have their strength and weaknesses and will come down to the trading style of the individual trader and their tolerance to money management (R&R).