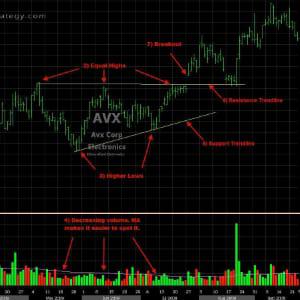
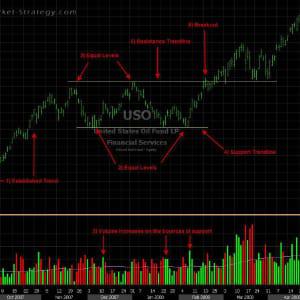
Ascending Triangle
Chart Patterns
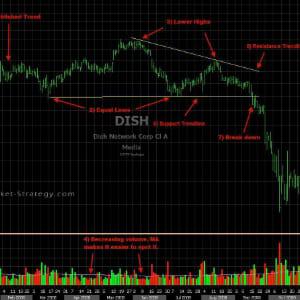
Descending Triangle
Chart Patterns
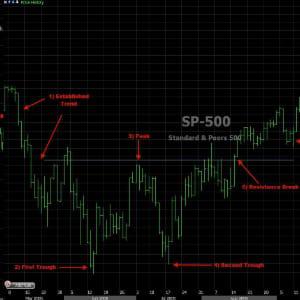
Double Bottom
Chart Patterns
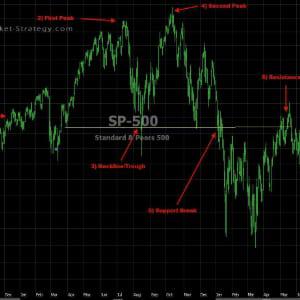
Double Top
Chart Patterns
Flags & Pennants
Chart Patterns
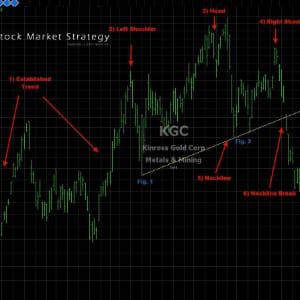
Head and Shoulders
Chart Patterns
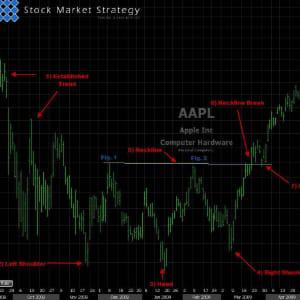
Inverted Head and Shoulders
Chart Patterns
Rectangle
Chart Patterns
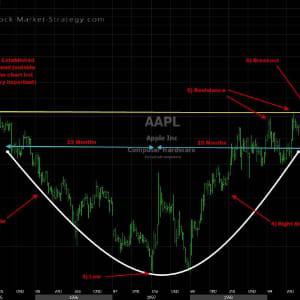
Rounding Bottom
Chart Patterns

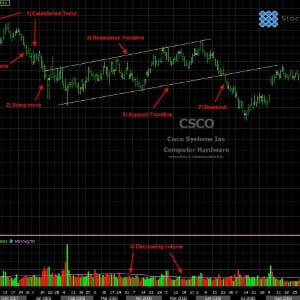
Symmetrical Triangle
Chart Patterns